Whiteside County, Illinois
Whiteside County is a county located in the U.S. state of Illinois. According to the 2010 census, it had a population of 58,498.[1] Its county seat is Morrison.[2] The county is bounded on the west by the Mississippi River.
Whiteside County | |
|---|---|
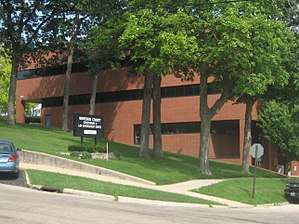 Whiteside County Courthouse, Morrison | |
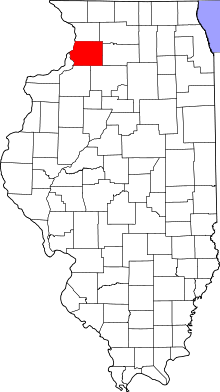 Location within the U.S. state of Illinois | |
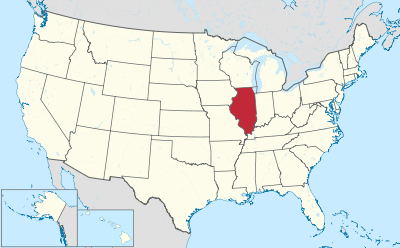 Illinois's location within the U.S. | |
| Coordinates: 41°45′N 89°55′W | |
| Country | |
| State | |
| Founded | 1836 |
| Named for | Samuel Whiteside |
| Seat | Morrison |
| Largest city | Sterling |
| Area | |
| • Total | 697 sq mi (1,810 km2) |
| • Land | 684 sq mi (1,770 km2) |
| • Water | 12 sq mi (30 km2) 1.8% |
| Population (2010) | |
| • Total | 58,498 |
| • Estimate (2018) | 55,626 |
| • Density | 84/sq mi (32/km2) |
| Time zone | UTC−6 (Central) |
| • Summer (DST) | UTC−5 (CDT) |
| Congressional district | 17th |
| Website | www |
Whiteside County comprises the Sterling, IL Micropolitan Statistical Area, which is also included in the Dixon-Sterling, IL Combined Statistical Area.
Former U.S. President Ronald Reagan was born in the Whiteside County community of Tampico.
History
This area was long occupied by varying cultures of Native Americans.
Whiteside County was organized by European Americans in 1836 from parts of Jo Daviess and Henry counties. It was named for General Samuel Whiteside, an Illinois officer in the War of 1812 and Black Hawk War.
 Whiteside County's boundaries have remained unchanged since its creation in 1836.
Geography
According to the U.S. Census Bureau, the county has a total area of 697 square miles (1,810 km2), of which 684 square miles (1,770 km2) is land and 12 square miles (31 km2) (1.8%) is water.[3]
Climate and weather
| Morrison, Illinois | ||||||||||||||||||||||||||||||||||||||||||||||||||||||||||||
|---|---|---|---|---|---|---|---|---|---|---|---|---|---|---|---|---|---|---|---|---|---|---|---|---|---|---|---|---|---|---|---|---|---|---|---|---|---|---|---|---|---|---|---|---|---|---|---|---|---|---|---|---|---|---|---|---|---|---|---|---|
| Climate chart (explanation) | ||||||||||||||||||||||||||||||||||||||||||||||||||||||||||||
| ||||||||||||||||||||||||||||||||||||||||||||||||||||||||||||
| ||||||||||||||||||||||||||||||||||||||||||||||||||||||||||||
In recent years, average temperatures in the county seat of Morrison have ranged from a low of 10 °F (−12 °C) in January to a high of 85 °F (29 °C) in July, although a record low of −30 °F (−34 °C) was recorded in February 1905 and a record high of 112 °F (44 °C) was recorded in July 1936. Average monthly precipitation ranged from 1.51 inches (38 mm) in February to 4.69 inches (119 mm) in August.[4]
Major highways


Adjacent counties
- Carroll County (north)
- Ogle County (northeast)
- Lee County (east)
- Bureau County (southeast)
- Henry County (south)
- Rock Island County (southwest)
- Clinton County, Iowa (west)
National protected area
Demographics
| Historical population | |||
|---|---|---|---|
| Census | Pop. | %± | |
| 1840 | 2,514 | — | |
| 1850 | 5,361 | 113.2% | |
| 1860 | 18,737 | 249.5% | |
| 1870 | 27,503 | 46.8% | |
| 1880 | 30,885 | 12.3% | |
| 1890 | 30,854 | −0.1% | |
| 1900 | 34,710 | 12.5% | |
| 1910 | 34,507 | −0.6% | |
| 1920 | 36,174 | 4.8% | |
| 1930 | 39,019 | 7.9% | |
| 1940 | 43,338 | 11.1% | |
| 1950 | 49,336 | 13.8% | |
| 1960 | 59,887 | 21.4% | |
| 1970 | 62,877 | 5.0% | |
| 1980 | 65,970 | 4.9% | |
| 1990 | 60,186 | −8.8% | |
| 2000 | 60,653 | 0.8% | |
| 2010 | 58,498 | −3.6% | |
| Est. 2018 | 55,626 | [5] | −4.9% |
| U.S. Decennial Census[6] 1790-1960[7] 1900-1990[8] 1990-2000[9] 2010-2013[1] | |||
As of the 2010 United States Census, there were 58,498 people, 23,740 households, and 16,005 families residing in the county.[10] The population density was 85.5 inhabitants per square mile (33.0/km2). There were 25,770 housing units at an average density of 37.7 per square mile (14.6/km2).[3] The racial makeup of the county was 92.2% white, 1.3% black or African American, 0.5% Asian, 0.3% American Indian, 3.5% from other races, and 2.2% from two or more races. Those of Hispanic or Latino origin made up 11.0% of the population.[10] In terms of ancestry, 32.5% were German, 15.5% were Irish, 8.7% were Dutch, 8.6% were English, and 6.0% were American.[11]
Of the 23,740 households, 30.4% had children under the age of 18 living with them, 51.5% were married couples living together, 11.0% had a female householder with no husband present, 32.6% were non-families, and 27.7% of all households were made up of individuals. The average household size was 2.42 and the average family size was 2.92. The median age was 41.8 years.[10]
The median income for a household in the county was $45,266 and the median income for a family was $54,242. Males had a median income of $41,862 versus $29,157 for females. The per capita income for the county was $23,405. About 8.2% of families and 11.2% of the population were below the poverty line, including 17.6% of those under age 18 and 5.8% of those age 65 or over.[12]
Politics
| Year | Republican | Democratic | Third parties |
|---|---|---|---|
| 2016 | 49.3% 12,615 | 43.1% 11,035 | 7.6% 1,932 |
| 2012 | 40.5% 10,448 | 57.4% 14,833 | 2.1% 547 |
| 2008 | 40.3% 10,883 | 57.8% 15,607 | 1.9% 504 |
| 2004 | 48.2% 12,959 | 51.1% 13,723 | 0.7% 191 |
| 2000 | 45.3% 11,252 | 51.9% 12,886 | 2.8% 699 |
| 1996 | 38.0% 8,859 | 51.0% 11,913 | 11.0% 2,572 |
| 1992 | 37.4% 10,146 | 45.4% 12,329 | 17.2% 4,678 |
| 1988 | 53.1% 12,978 | 46.3% 11,328 | 0.6% 156 |
| 1984 | 59.6% 16,743 | 40.0% 11,226 | 0.5% 127 |
| 1980 | 66.7% 17,389 | 27.6% 7,191 | 5.7% 1,484 |
| 1976 | 55.3% 14,308 | 43.5% 11,255 | 1.1% 291 |
| 1972 | 68.4% 17,305 | 31.3% 7,909 | 0.3% 87 |
| 1968 | 61.9% 15,177 | 33.2% 8,132 | 5.0% 1,225 |
| 1964 | 50.8% 12,940 | 49.2% 12,536 | |
| 1960 | 65.6% 17,434 | 34.3% 9,112 | 0.2% 46 |
| 1956 | 74.0% 17,589 | 25.9% 6,158 | 0.2% 37 |
| 1952 | 73.3% 17,294 | 26.4% 6,238 | 0.3% 67 |
| 1948 | 70.3% 12,922 | 28.8% 5,299 | 0.8% 154 |
| 1944 | 71.2% 14,162 | 27.9% 5,555 | 0.9% 171 |
| 1940 | 67.8% 15,752 | 31.7% 7,356 | 0.6% 134 |
| 1936 | 59.6% 12,666 | 37.6% 7,982 | 2.8% 595 |
| 1932 | 61.1% 11,388 | 37.6% 7,010 | 1.2% 228 |
| 1928 | 76.6% 13,580 | 23.0% 4,079 | 0.4% 69 |
| 1924 | 74.0% 11,532 | 12.6% 1,957 | 13.4% 2,087 |
| 1920 | 81.7% 10,923 | 14.4% 1,927 | 3.9% 513 |
| 1916 | 69.2% 10,045 | 26.5% 3,839 | 4.3% 623 |
| 1912 | 18.6% 1,437 | 25.9% 1,996 | 55.5% 4,278 |
| 1908 | 65.7% 5,257 | 26.8% 2,140 | 7.5% 600 |
| 1904 | 71.2% 5,636 | 19.5% 1,546 | 9.3% 737 |
| 1900 | 65.2% 5,663 | 31.8% 2,758 | 3.1% 266 |
| 1896 | 65.4% 5,577 | 32.7% 2,788 | 1.9% 159 |
| 1892 | 54.0% 3,819 | 39.3% 2,779 | 6.7% 474 |
Whiteside County has a political history typical of Northern Illinois. Between its first election in 1840, and 1852, it always favored the Whig Party, and although Whiteside was not as strong for the Free Soil Party as counties to the east like Boone and Lake, it gave substantial votes to that party in 1848[14] and 1852[15] and became powerfully Republican for the next century-and-a-quarter. Between 1856 and 1988 the only time Whiteside County did not vote for the Republican candidate was in 1912 when the GOP was mortally divided and Whiteside County voted for Progressive Party nominee and former President Theodore Roosevelt over conservative incumbent William Howard Taft. Between at least 1880 and 1960, no Democratic Presidential nominee ever won forty percent of Whiteside County's vote, and even Alf Landon in 1936 carried the county by 22 percent when losing 46 of 48 states.
In 1964 the Republican Party nominated Barry Goldwater, whose hostility to the Yankee establishment and strongly conservative policies were sufficient to leave many traditional Republicans to stay home or even to vote for Lyndon Johnson,[16] who lost the county only by 404 votes out of over twenty-five thousand. The county returned to solid Republican voting for the next twenty years, but, ironically when its most famous native came within 3,818 votes of sweeping all fifty states, actually voted marginally more Democratic than the nation at-large in 1984, repeated this in 1988 and voted Democratic for the first time in its history by giving a plurality to Bill Clinton in 1992. The county would give its first-ever Democratic majority to president Clinton in 1996 and continue to vote Democratic until 2016, when concern over employment declines in the “Rust Belt“ saw Donald Trump become the first Republican to carry the county since George H. W. Bush.
See also
References
- "State & County QuickFacts". United States Census Bureau. Retrieved July 9, 2014.
- "Find a County". National Association of Counties. Retrieved June 7, 2011.
- "Population, Housing Units, Area, and Density: 2010 - County". United States Census Bureau. Archived from the original on February 12, 2020. Retrieved July 12, 2015.
- "Monthly Averages for Morrison, Illinois". The Weather Channel. Retrieved January 27, 2011.
- "Population and Housing Unit Estimates". Retrieved November 2, 2019.
- "U.S. Decennial Census". United States Census Bureau. Retrieved July 9, 2014.
- "Historical Census Browser". University of Virginia Library. Retrieved July 9, 2014.
- "Population of Counties by Decennial Census: 1900 to 1990". United States Census Bureau. Retrieved July 9, 2014.
- "Census 2000 PHC-T-4. Ranking Tables for Counties: 1990 and 2000" (PDF). United States Census Bureau. Retrieved July 9, 2014.
- "Profile of General Population and Housing Characteristics: 2010 Demographic Profile Data". United States Census Bureau. Archived from the original on February 13, 2020. Retrieved July 12, 2015.
- "Selected Social Characteristics in the United States – 2006-2010 American Community Survey 5-Year Estimates". United States Census Bureau. Archived from the original on February 13, 2020. Retrieved July 12, 2015.
- "Selected Economic Characteristics – 2006-2010 American Community Survey 5-Year Estimates". United States Census Bureau. Archived from the original on February 13, 2020. Retrieved July 12, 2015.
- Leip, David. "Dave Leip's Atlas of U.S. Presidential Elections". uselectionatlas.org. Archived from the original on March 23, 2018.
- Géoelections; Popular Vote for Martin van Buren (Free Soil) (.xlsx file for €15)
- Géoelections; Popular Vote for John P. Hale (.xlsx file for €15)
- Phillips, Kevin P.; The Emerging Republican Majority, pp. 61-65 ISBN 9780691163246
External links
Places adjacent to Whiteside County, Illinois | ||||||||||
|---|---|---|---|---|---|---|---|---|---|---|
| ||||||||||
Municipalities and communities of Whiteside County, Illinois, United States | ||
|---|---|---|
| Cities | Map of Illinois highlighting Whiteside County | |
| Villages | ||
| Townships | ||
| CDP | ||
| Other unincorporated communities |
| |
| Authority control |
|
|---|