Cumberland County, Illinois
Cumberland County is a county located in the U.S. state of Illinois. As of the 2010 census, the population was 11,048.[1] Its county seat is Toledo.[2]
Cumberland County | |
|---|---|
 | |
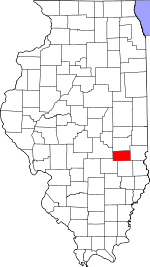 Location within the U.S. state of Illinois | |
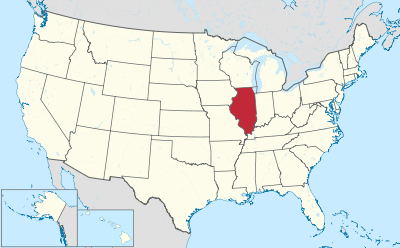 Illinois's location within the U.S. | |
| Coordinates: 39°16′N 88°14′W | |
| Country | |
| State | |
| Founded | 1843 |
| Named for | Cumberland Road |
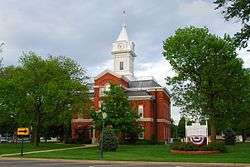
| Seat | Toledo |
| Largest city | Neoga |
| Area | |
| • Total | 347 sq mi (900 km2) |
| • Land | 346 sq mi (900 km2) |
| • Water | 1.0 sq mi (3 km2) 0.3% |
| Population (2010) | |
| • Total | 11,048 |
| • Estimate (2018) | 10,808 |
| • Density | 32/sq mi (12/km2) |
| Congressional district | 15th |
| Website | cumberlandco |
Cumberland County is part of the Charleston–Mattoon, IL Micropolitan Statistical Area.
History
Cumberland County was created on March 2, 1843, from parts of Coles County. It is named for the National Road (Cumberland Road), which was projected to run through it.[3]
 Cumberland County at the time of its creation in 1843
Geography
According to the U.S. Census Bureau, the county has a total area of 347 square miles (900 km2), of which 346 square miles (900 km2) is land and 1.0 square mile (2.6 km2) (0.3%) is water.[4]
Climate and weather
| Toledo, Illinois | ||||||||||||||||||||||||||||||||||||||||||||||||||||||||||||
|---|---|---|---|---|---|---|---|---|---|---|---|---|---|---|---|---|---|---|---|---|---|---|---|---|---|---|---|---|---|---|---|---|---|---|---|---|---|---|---|---|---|---|---|---|---|---|---|---|---|---|---|---|---|---|---|---|---|---|---|---|
| Climate chart (explanation) | ||||||||||||||||||||||||||||||||||||||||||||||||||||||||||||
| ||||||||||||||||||||||||||||||||||||||||||||||||||||||||||||
| ||||||||||||||||||||||||||||||||||||||||||||||||||||||||||||
In recent years, average temperatures in the county seat of Toledo have ranged from a low of 17 °F (−8 °C) in January to a high of 86 °F (30 °C) in July, although a record low of −23 °F (−31 °C) was recorded in January 1985 (jobs) and a record high of 111 °F (44 °C) was recorded in July 1954. Average monthly precipitation ranged from 2.03 inches (52 mm) in January to 4.21 inches (107 mm) in June.[5]
Adjacent counties
- Coles County - north
- Clark County - east
- Jasper County - south
- Effingham County - southwest
- Shelby County - west
Major highways


Demographics
| Historical population | |||
|---|---|---|---|
| Census | Pop. | %± | |
| 1850 | 3,718 | — | |
| 1860 | 8,311 | 123.5% | |
| 1870 | 12,223 | 47.1% | |
| 1880 | 13,759 | 12.6% | |
| 1890 | 15,443 | 12.2% | |
| 1900 | 16,124 | 4.4% | |
| 1910 | 14,281 | −11.4% | |
| 1920 | 12,858 | −10.0% | |
| 1930 | 10,419 | −19.0% | |
| 1940 | 11,698 | 12.3% | |
| 1950 | 10,496 | −10.3% | |
| 1960 | 9,936 | −5.3% | |
| 1970 | 9,772 | −1.7% | |
| 1980 | 11,062 | 13.2% | |
| 1990 | 10,670 | −3.5% | |
| 2000 | 11,253 | 5.5% | |
| 2010 | 11,048 | −1.8% | |
| Est. 2018 | 10,808 | [6] | −2.2% |
| U.S. Decennial Census[7] 1790-1960[8] 1900-1990[9] 1990-2000[10] 2010-2013[1] | |||

As of the 2010 United States Census, there were 11,048 people, 4,377 households, and 3,121 families living in the county.[11] The population density was 31.9 inhabitants per square mile (12.3/km2). There were 4,874 housing units at an average density of 14.1 per square mile (5.4/km2).[4] The racial makeup of the county was 98.3% white, 0.3% black or African American, 0.2% Asian, 0.2% American Indian, 0.2% from other races, and 0.8% from two or more races. Those of Hispanic or Latino origin made up 0.7% of the population.[11] In terms of ancestry, 30.6% were German, 17.4% were American, 11.7% were Irish, and 11.4% were English.[12]
Of the 4,377 households, 31.3% had children under the age of 18 living with them, 57.7% were married couples living together, 8.6% had a female householder with no husband present, 28.7% were non-families, and 24.3% of all households were made up of individuals. The average household size was 2.50 and the average family size was 2.95. The median age was 40.9 years.[11]
The median income for a household in the county was $42,101 and the median income for a family was $51,729. Males had a median income of $42,157 versus $29,142 for females. The per capita income for the county was $21,262. About 8.1% of families and 12.5% of the population were below the poverty line, including 19.4% of those under age 18 and 8.2% of those age 65 or over.[13]
Communities
Cities
- Neoga
- Casey (mostly in Clark County)
Villages
- Greenup
- Jewett
- Montrose (mostly in Effingham County)
- Toledo
- Hazel Dell
- Walla Walla
- Dees
Townships
Cumberland County is divided into eight townships:
Politics
Although predominantly Democratic in the years before World War I, in the aftermath of which Woodrow Wilson’s policies towards Germany were locally deplored, Cumberland County has since become powerfully Republican. Even in Franklin D. Roosevelt’s 1932 and 1936 landslides, he won only small victories, and since then only three Democrats have carried the county. Bill Clinton, who won a plurality in 1992, is the last Democrat to reach forty percent of the county’s vote, and in 2016, the rapid Upland South trend towards overwhelmingly Republican voting caused his wife Hillary to win less than twenty percent of the county’s ballots.
| Year | Republican | Democratic | Third parties |
|---|---|---|---|
| 2016 | 75.5% 4,206 | 18.5% 1,031 | 6.0% 334 |
| 2012 | 66.3% 3,509 | 31.0% 1,641 | 2.7% 145 |
| 2008 | 59.1% 3,156 | 38.5% 2,055 | 2.4% 128 |
| 2004 | 64.6% 3,497 | 34.4% 1,862 | 1.1% 57 |
| 2000 | 59.6% 2,964 | 37.6% 1,870 | 2.8% 141 |
| 1996 | 44.8% 2,002 | 39.7% 1,776 | 15.5% 691 |
| 1992 | 35.8% 1,860 | 40.6% 2,111 | 23.7% 1,231 |
| 1988 | 58.0% 2,667 | 41.4% 1,904 | 0.6% 29 |
| 1984 | 63.0% 3,002 | 36.4% 1,733 | 0.6% 27 |
| 1980 | 59.7% 3,159 | 35.8% 1,892 | 4.5% 238 |
| 1976 | 47.1% 2,518 | 51.5% 2,752 | 1.4% 74 |
| 1972 | 60.8% 3,257 | 38.9% 2,083 | 0.3% 18 |
| 1968 | 53.1% 2,671 | 36.4% 1,828 | 10.5% 529 |
| 1964 | 42.4% 2,251 | 57.6% 3,056 | |
| 1960 | 54.9% 3,020 | 45.0% 2,475 | 0.1% 5 |
| 1956 | 58.7% 3,235 | 41.2% 2,272 | 0.1% 5 |
| 1952 | 59.9% 3,302 | 39.9% 2,200 | 0.2% 12 |
| 1948 | 50.7% 2,451 | 48.7% 2,353 | 0.6% 28 |
| 1944 | 52.9% 2,700 | 46.8% 2,391 | 0.3% 15 |
| 1940 | 51.6% 3,330 | 47.9% 3,091 | 0.5% 30 |
| 1936 | 47.5% 3,016 | 51.8% 3,290 | 0.8% 50 |
| 1932 | 40.7% 2,166 | 58.8% 3,128 | 0.6% 30 |
| 1928 | 63.0% 3,242 | 36.4% 1,873 | 0.5% 28 |
| 1924 | 51.1% 2,698 | 45.1% 2,384 | 3.8% 199 |
| 1920 | 58.2% 3,095 | 40.6% 2,162 | 1.2% 63 |
| 1916 | 48.2% 2,879 | 49.6% 2,960 | 2.3% 134 |
| 1912 | 28.7% 990 | 48.6% 1,673 | 22.7% 777 |
| 1908 | 47.7% 1,739 | 49.6% 1,810 | 2.7% 100 |
| 1904 | 50.4% 1,857 | 44.6% 1,644 | 5.0% 184 |
| 1900 | 47.6% 1,870 | 50.7% 1,993 | 1.7% 65 |
| 1896 | 46.5% 1,856 | 52.6% 2,098 | 0.9% 36 |
| 1892 | 41.2% 1,470 | 50.0% 1,785 | 8.8% 315 |
References
- History of Southern Illinois, George Washington Smith, 1912.
- United States Census Bureau 2007 TIGER/Line Shapefiles
- United States Board on Geographic Names (GNIS)
- United States National Atlas
- "State & County QuickFacts". United States Census Bureau. Retrieved July 4, 2014.
- "Find a County". National Association of Counties. Archived from the original on May 31, 2011. Retrieved June 7, 2011.
- Gannett, Henry (1905). The Origin of Certain Place Names in the United States. Govt. Print. Off. pp. 97.
- "Population, Housing Units, Area, and Density: 2010 - County". United States Census Bureau. Archived from the original on February 12, 2020. Retrieved July 11, 2015.
- "Monthly Averages for Toledo, Illinois". The Weather Channel. Retrieved January 27, 2011.
- "Population and Housing Unit Estimates". Retrieved November 6, 2019.
- "U.S. Decennial Census". United States Census Bureau. Retrieved July 4, 2014.
- "Historical Census Browser". University of Virginia Library. Retrieved July 4, 2014.
- "Population of Counties by Decennial Census: 1900 to 1990". United States Census Bureau. Retrieved July 4, 2014.
- "Census 2000 PHC-T-4. Ranking Tables for Counties: 1990 and 2000" (PDF). United States Census Bureau. Retrieved July 4, 2014.
- "DP-1 Profile of General Population and Housing Characteristics: 2010 Demographic Profile Data". United States Census Bureau. Archived from the original on February 13, 2020. Retrieved July 11, 2015.
- "DP02 SELECTED SOCIAL CHARACTERISTICS IN THE UNITED STATES – 2006-2010 American Community Survey 5-Year Estimates". United States Census Bureau. Archived from the original on February 13, 2020. Retrieved July 11, 2015.
- "DP03 SELECTED ECONOMIC CHARACTERISTICS – 2006-2010 American Community Survey 5-Year Estimates". United States Census Bureau. Archived from the original on February 13, 2020. Retrieved July 11, 2015.
- Leip, David. "Dave Leip's Atlas of U.S. Presidential Elections". uselectionatlas.org. Retrieved October 31, 2018.
Places adjacent to Cumberland County, Illinois | ||||||||||
|---|---|---|---|---|---|---|---|---|---|---|
| ||||||||||
Municipalities and communities of Cumberland County, Illinois, United States | ||
|---|---|---|
| Cities | Map of Illinois highlighting Cumberland County | |
| Villages | ||
| Townships | ||
| Unincorporated communities | ||
| Footnotes | ‡This populated place also has portions in an adjacent county or counties | |

| Authority control |
|
|---|