Williamson County, Illinois
Williamson County is a county located in the southern part of the U.S. state of Illinois. According to the 2010 census, it had a population of 66,357.[1] Its county seat is Marion.[2]
Williamson County | |
|---|---|
 Williamson County Courthouse in Marion | |
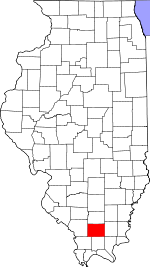 Location within the U.S. state of Illinois | |
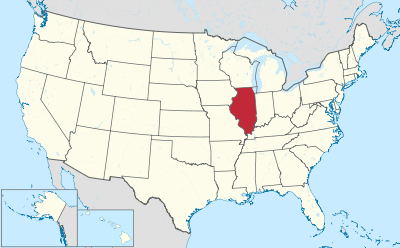 Illinois's location within the U.S. | |
| Coordinates: 37°44′N 88°56′W | |
| Country | |
| State | |
| Founded | 1839 |
| Named for | Williamson County, Tennessee |
| Seat | Marion |
| Largest city | Marion |
| Area | |
| • Total | 444 sq mi (1,150 km2) |
| • Land | 420 sq mi (1,100 km2) |
| • Water | 24 sq mi (60 km2) 5.4% |
| Population (2010) | |
| • Total | 66,357 |
| • Estimate (2018) | 67,056 |
| • Density | 150/sq mi (58/km2) |
| Time zone | UTC−6 (Central) |
| • Summer (DST) | UTC−5 (CDT) |
| Congressional district | 12th |
| Website | www |
Williamson County is included in the Carbondale-Marion, IL Metropolitan Statistical Area. This area of Southern Illinois is known as Little Egypt.
Williamson is a rapidly growing county in the Metro Lakeland area and is located 88 miles (142 km) southeast of St. Louis, Missouri. Via the nearby intersection of Interstates 57 and 24, and Illinois Route 13, a primary east-west four-lane expressway, the city easily has access to the major communities of Murphysboro, Carbondale, Carterville, Herrin, Marion and Harrisburg.
The Metro Lakeland area of Jackson-Williamson counties has a total of 120,000 residents. Carbondale (14 miles west), Herrin and Marion are the key urban areas in Metro Lakeland, with a combined population of more than 65,000. Over 235,000 people live within 35 miles (56 km).
History
Williamson County was formed from Franklin County on February 28, 1839, and was named for Williamson County, Tennessee. Many of its early settlers were from the Uplands South, traveling via the Ohio River from Kentucky and Virginia.[3]
 Williamson County at the time of its creation in 1839
It became a center of coal mining, attracting numerous European immigrants in the late 19th and early 20th centuries. Labor tensions rose as workers sought to unionize and improve their wages and conditions. Mine owners resisted and several episodes of violence resulted during strikes and other work actions. resulted in several episodes of violence. Williamson County is often referred to as "Bloody Williamson," due to several outbreaks of violence that have few parallels in American history.[4]
These include the Bloody Vendetta (1876), armed confrontation between families and associates during the waning days of Reconstruction; the Carterville Massacre (1899), a Coal Strike (1906), the Herrin Massacre (1922), the Klan War (1924–1926), and the Birger/Shelton Gang War (1926).
During the so-called Klan War, a mob of perhaps 1,300 men were deputized by the local sheriff. Starting on 1 February 1924, the pose began raiding the homes of local mine workers, mostly Italian immigrants. The Klan was inspired by both nativist and Prohibitionist fervor. Violence continued sporadically between bootleggers and the Klan. Twenty people were killed before peace was restored. [5]
In June 1915, a Sicilian miner accused of the fatal shooting of a wealthy local resident was lynched in Johnston City, Illinois by a mob.[6] The Illinois National Guard was deployed to prevent rioting between the miner's supporters and opponents. They were also later ordered to various locations repeatedly during the 1920s to separate warring parties and attempt to keep order.
Severe weather in Williamson County is not uncommon. The northwest section of the county suffered extensive damage during the Tri-State Tornado of 1925. The county was also struck by two tornadoes on May 29, 1982, which killed 10 people in the Marion, Illinois tornado outbreak. On May 8, 2009, the cities of Carterville, Herrin, and Marion were severely damaged by the May 2009 Southern Midwest derecho.
Geography

According to the U.S. Census Bureau, the county has a total area of 444 square miles (1,150 km2), of which 420 square miles (1,100 km2) is land and 24 square miles (62 km2) (5.4%) is water.[7]
Adjacent counties
- Franklin County (north)
- Saline County (east)
- Pope County (southeast)
- Johnson County (south)
- Union County (southwest)
- Jackson County (west)
National protected area
Major highways
Airport
Williamson County Regional Airport is the local airport.
Demographics
| Historical population | |||
|---|---|---|---|
| Census | Pop. | %± | |
| 1840 | 4,457 | — | |
| 1850 | 7,216 | 61.9% | |
| 1860 | 12,205 | 69.1% | |
| 1870 | 17,329 | 42.0% | |
| 1880 | 19,324 | 11.5% | |
| 1890 | 22,226 | 15.0% | |
| 1900 | 27,796 | 25.1% | |
| 1910 | 45,098 | 62.2% | |
| 1920 | 61,092 | 35.5% | |
| 1930 | 53,880 | −11.8% | |
| 1940 | 51,424 | −4.6% | |
| 1950 | 48,621 | −5.5% | |
| 1960 | 46,117 | −5.2% | |
| 1970 | 49,021 | 6.3% | |
| 1980 | 56,538 | 15.3% | |
| 1990 | 57,733 | 2.1% | |
| 2000 | 61,296 | 6.2% | |
| 2010 | 66,357 | 8.3% | |
| Est. 2018 | 67,056 | [8] | 1.1% |
| U.S. Decennial Census[9] 1790-1960[10] 1900-1990[11] 1990-2000[12] 2010-2013[1] | |||
As of the 2010 United States Census, there were 66,357 people, 27,421 households, and 17,999 families residing in the county.[13] The population density was 157.9 inhabitants per square mile (61.0/km2). There were 30,359 housing units at an average density of 72.3 per square mile (27.9/km2).[7] The racial makeup of the county was 92.7% white, 3.8% black or African American, 0.8% Asian, 0.4% American Indian, 0.5% from other races, and 1.7% from two or more races. Those of Hispanic or Latino origin made up 2.0% of the population.[13] In terms of ancestry, 23.6% were German, 17.3% were Irish, 16.0% were English, 9.0% were American, and 6.1% were Italian.[14]
Of the 27,421 households, 30.2% had children under the age of 18 living with them, 49.4% were married couples living together, 11.5% had a female householder with no husband present, 34.4% were non-families, and 29.1% of all households were made up of individuals. The average household size was 2.35 and the average family size was 2.88. The median age was 40.1 years.[13]
The median income for a household in the county was $40,579 and the median income for a family was $50,929. Males had a median income of $41,428 versus $30,901 for females. The per capita income for the county was $22,164. About 13.3% of families and 16.7% of the population were below the poverty line, including 24.3% of those under age 18 and 9.9% of those age 65 or over.[15]
Government and infrastructure
United States Penitentiary, Marion is located in Southern Precinct in Williamson County.[16][17]
Politics
| Year | Republican | Democratic | Third parties |
|---|---|---|---|
| 2016 | 67.7% 21,570 | 26.9% 8,581 | 5.3% 1,701 |
| 2012 | 61.2% 17,909 | 36.4% 10,647 | 2.4% 698 |
| 2008 | 56.3% 17,039 | 41.6% 12,589 | 2.1% 638 |
| 2004 | 60.4% 18,086 | 39.0% 11,685 | 0.6% 189 |
| 2000 | 52.0% 14,012 | 45.3% 12,192 | 2.7% 735 |
| 1996 | 38.5% 9,734 | 49.5% 12,510 | 12.0% 3,028 |
| 1992 | 32.9% 9,462 | 49.9% 14,361 | 17.2% 4,937 |
| 1988 | 48.8% 12,274 | 50.6% 12,712 | 0.6% 144 |
| 1984 | 56.1% 14,930 | 43.6% 11,614 | 0.3% 86 |
| 1980 | 55.1% 14,451 | 41.1% 10,779 | 3.8% 998 |
| 1976 | 43.6% 10,703 | 55.4% 13,600 | 1.0% 250 |
| 1972 | 60.0% 14,101 | 39.2% 9,202 | 0.8% 189 |
| 1968 | 50.4% 11,886 | 41.0% 9,660 | 8.7% 2,042 |
| 1964 | 38.5% 9,130 | 61.6% 14,613 | 0.0% 0 |
| 1960 | 54.7% 13,732 | 45.2% 11,335 | 0.1% 29 |
| 1956 | 56.4% 13,438 | 43.5% 10,345 | 0.1% 27 |
| 1952 | 55.1% 13,348 | 44.7% 10,838 | 0.2% 37 |
| 1948 | 51.0% 10,386 | 48.3% 9,841 | 0.6% 130 |
| 1944 | 55.6% 12,594 | 44.0% 9,974 | 0.5% 103 |
| 1940 | 49.4% 14,433 | 50.1% 14,645 | 0.5% 139 |
| 1936 | 45.1% 12,319 | 53.6% 14,663 | 1.3% 352 |
| 1932 | 39.1% 8,714 | 58.2% 12,961 | 2.7% 590 |
| 1928 | 51.2% 10,913 | 47.6% 10,139 | 1.2% 257 |
| 1924 | 45.3% 9,366 | 29.6% 6,117 | 25.2% 5,206 |
| 1920 | 56.7% 10,118 | 26.5% 4,728 | 16.8% 2,988 |
| 1916 | 53.5% 10,262 | 42.6% 8,172 | 3.9% 746 |
| 1912 | 34.6% 3,209 | 35.2% 3,258 | 30.2% 2,800 |
| 1908 | 52.6% 4,786 | 38.6% 3,513 | 8.7% 794 |
| 1904 | 59.0% 4,044 | 29.1% 1,996 | 11.9% 819 |
| 1900 | 56.9% 3,723 | 42.2% 2,760 | 0.9% 57 |
| 1896 | 53.7% 3,027 | 45.8% 2,582 | 0.5% 28 |
| 1892 | 51.3% 2,504 | 43.4% 2,118 | 5.3% 256 |
Climate and weather
| Marion, Illinois | ||||||||||||||||||||||||||||||||||||||||||||||||||||||||||||
|---|---|---|---|---|---|---|---|---|---|---|---|---|---|---|---|---|---|---|---|---|---|---|---|---|---|---|---|---|---|---|---|---|---|---|---|---|---|---|---|---|---|---|---|---|---|---|---|---|---|---|---|---|---|---|---|---|---|---|---|---|
| Climate chart (explanation) | ||||||||||||||||||||||||||||||||||||||||||||||||||||||||||||
| ||||||||||||||||||||||||||||||||||||||||||||||||||||||||||||
| ||||||||||||||||||||||||||||||||||||||||||||||||||||||||||||
Williamson County lies on the border between humid continental climate (Köppen climate classification Dfa) and humid subtropical climate (Köppen climate classification Cfa), with neither large mountains nor large bodies of water to moderate its temperature. It is subject to both cold Arctic air and hot, humid tropical air from the Gulf of Mexico and, along with the rest of the midwestern United States, is home to some of the largest temperature extremes in the world.
The region has four distinct seasons. Spring is the wettest season and produces erratic severe weather ranging from tornadoes to winter storms. Summers are hot and humid, with only occasional and brief respite, and the humidity often makes the heat index rise to temperatures feeling well above 100 °F (38 °C). Fall is mild with lower humidity and can produce intermittent bouts of heavy rainfall, with the first snow flurries usually forming in late November. Winters are cold with periodic snow and temperatures often below freezing; however, thaws are usually frequent. Winter storm systems, such as Alberta clippers and Panhandle hooks, can bring days of heavy freezing rain, ice pellets, and snowfall.
The normal high temperature in July is 90 °F (32 °C), and the normal low temperature in January is 19 °F (−6 °C), although this varies from year to year. Both 100 °F (37.8 °C) and 0 °F (−17.8 °C) temperatures can be seen on an average 2 or 3 days per year. In recent years, average temperatures have ranged from a low of 19 °F (−7 °C) in January to a high of 88 °F (31 °C) in July, although a record low of −25 °F (−32 °C) was recorded in January 1977 and a record high of 113 °F (45 °C) was recorded in August 1977. Average monthly precipitation ranged from 3.06 inches (78 mm) in October to 4.93 inches (125 mm) in May.[19]
Williamson County has thunderstorms about 50 days a year on average. Thunderstorms contribute over half of the annual precipitation. Especially in the spring, these storms can often be severe, with high winds, large hail and tornadoes.
Some late autumns feature the warm weather known as Indian summer; some years see roses in bloom as late as early December.
Communities
Cities
Census-designated places
Other unincorporated communities
Ghost towns
Precincts
The following precincts are not voting precincts, but represent the 12 Congressional townships in Williamson County. Most have multiple voting precincts.
References
- "State & County QuickFacts". United States Census Bureau. Retrieved July 9, 2014.
- "Find a County". National Association of Counties. Retrieved June 7, 2011.
- Adams, James N. (compiler) (1989), Keller, William E. (ed.), Illinois Place Names, Springfield: Illinois State Historical Society, pp. 609, ISBN 0-912226-24-2
- Angle, Paul M. (1992), Bloody Williamson - A Chapter in American Lawlessness, University of Illinois Press, ISBN 0-252-06233-7
- Okrent, Daniel (May 31, 2011). Last Call; The Rise & fall of Prohibition (Kindle ed.). New York, London, Toronto: Simon & Schuster. p. 4631. ISBN 074327704X.
|access-date=requires|url=(help) - "SLAYER LYNCHED BY ILLINOIS MOB", Belvidere Daily Republican (Belvidere, Illinois), 11 June 1915; accessed 2 February 2017
- "Population, Housing Units, Area, and Density: 2010 - County". United States Census Bureau. Archived from the original on February 13, 2020. Retrieved July 12, 2015.
- "Population and Housing Unit Estimates". Retrieved November 2, 2019.
- "U.S. Decennial Census". United States Census Bureau. Retrieved July 9, 2014.
- "Historical Census Browser". University of Virginia Library. Retrieved July 9, 2014.
- "Population of Counties by Decennial Census: 1900 to 1990". United States Census Bureau. Retrieved July 9, 2014.
- "Census 2000 PHC-T-4. Ranking Tables for Counties: 1990 and 2000" (PDF). United States Census Bureau. Retrieved July 9, 2014.
- "DP-1 Profile of General Population and Housing Characteristics: 2010 Demographic Profile Data". United States Census Bureau. Archived from the original on February 13, 2020. Retrieved July 12, 2015.
- "DP02 SELECTED SOCIAL CHARACTERISTICS IN THE UNITED STATES – 2006-2010 American Community Survey 5-Year Estimates". United States Census Bureau. Archived from the original on February 13, 2020. Retrieved July 12, 2015.
- "DP03 SELECTED ECONOMIC CHARACTERISTICS – 2006-2010 American Community Survey 5-Year Estimates". United States Census Bureau. Archived from the original on February 13, 2020. Retrieved July 12, 2015.
- "USP Marion Contact Information." Federal Bureau of Prisons. Retrieved on June 5, 2010.
- "Marion city, Illinois." U.S. Census Bureau. Retrieved on June 5, 2010.
- Leip, David. "Dave Leip's Atlas of U.S. Presidential Elections". uselectionatlas.org. Retrieved November 13, 2018.
- "Monthly Averages for Marion, Illinois". The Weather Channel. Retrieved January 27, 2011.
Further reading
- Angle, Paul M. (1992). Bloody Williamson - A Chapter in American Lawlessness. University of Illinois Press. ISBN 0-252-06233-7.
- Ayabe, Masatomo, “Ku Kluxers in a Coal Mining Community: A Study of the Ku Klux Klan Movement in Williamson County, Illinois, 1923–1926,” Journal of the Illinois State Historical Society, 102 (Spring 2009), 73–100.
- Erwin, Milo. 1876, Rep. 1976. History of Williamson County, Illinois. Marion, Ill.: Williamson County Historical Society.
- Erwin, Milo, and Jon Musgrave. 2006. The Bloody Vendetta of Southern Illinois. Marion, Ill.: IllinoisHistory.com. 240 pages.
- Johnson, Ralph, and Jon Musgrave. 2010. Secrets of the Herrin Gangs. Marion, Ill.: IllinoisHistory.com. 96 pages.
Places adjacent to Williamson County, Illinois | ||||||||||
|---|---|---|---|---|---|---|---|---|---|---|
| ||||||||||
Municipalities and communities of Williamson County, Illinois, United States | ||
|---|---|---|
| Cities | Map of Illinois highlighting Williamson County | |
| Villages | ||
| Precincts | ||
| CDP | ||
| Other unincorporated communities |
| |
| Ghost towns | ||
| Footnotes | ‡This populated place also has portions in an adjacent county or counties | |

| Counties | 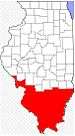 | |
|---|---|---|
| Mid-sized cities (25,000+) | ||
| Small Cities (10,000-25,000) | ||
| Small Cities (5,000-10,000) | ||
| Interstates | ||
| Airports/Military bases |
| |
| Universities | ||
| Colleges | ||
| Sports teams based in the Southern Illinois | ||
| Authority control |
|
|---|