United States presidential election in Washington (state), 1996
|
| |||||||||||||||||||||||||||||||||
| |||||||||||||||||||||||||||||||||
| |||||||||||||||||||||||||||||||||
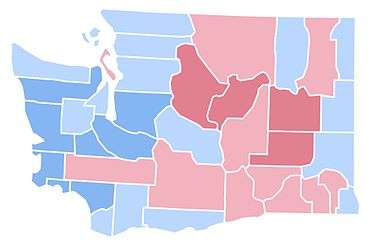 County Results
Clinton—50-60%
Clinton—40-50%
Dole—40-50%
Dole—50-60% | |||||||||||||||||||||||||||||||||
| |||||||||||||||||||||||||||||||||


| Elections in Washington |
|---|
 |
|
General elections
Gubernatorial elections
Attorney General elections Secretary of State elections State Senate elections State House elections State Supreme Court elections Other judicial elections |
|
|
The 1996 United States presidential election in Washington took place on November 5, 1996, as part of the 1996 United States presidential election. Voters chose eleven representatives, or electors to the Electoral College, who voted for president and vice president.
Washington State was won by President Bill Clinton (D) over Senator Bob Dole (R-KS), with Clinton winning 49.84 percent to 37.30 percent for a margin of 12.54 percent. Billionaire businessman Ross Perot (Reform Party of the United States of America-TX) finished in third, with 8.92 percent of the popular vote.[1] As of the 2016 presidential election, this is the last election in which Spokane County, Kittitas County, Pend Oreille County, Ferry County, and Asotin County voted for a Democratic presidential candidate.[2]
Results
| United States presidential election in Washington, 1996 | ||||||
|---|---|---|---|---|---|---|
| Party | Candidate | Running mate | Votes | Percentage | Electoral votes | |
| Democratic | Bill Clinton (incumbent) | Al Gore | 1,123,323 | 49.84% | 11 | |
| Republican | Bob Dole | Jack Kemp | 840,712 | 37.30% | 0 | |
| Reform | Ross Perot | Patrick Choate | 201,003 | 8.92% | 0 | |
| Green Party | Ralph Nader | Winona LaDuke | 60,322 | 2.68% | 0 | |
| Libertarian | Harry Browne | Jo Jorgensen | 12,522 | 0.56% | 0 | |
| Natural Law | Dr. John Hagelin | Dr. V. Tompkins | 6,076 | 0.27% | 0 | |
| U.S. Taxpayers' | Howard Phillips | Herbert Titus | 4,578 | 0.20% | 0 | |
| Independent | Charles Collins | Rosemary Giumarra | 2,374 | 0.11% | 0 | |
| Workers World Party | Monica Moorehead | Gloria La Riva | 2,189 | 0.10% | 0 | |
| Socialist Workers Party | James Harris | Laura Garza | 738 | 0.03% | 0 | |
| Totals | 2,253,837 | 100.0% | 11 | |||
Results by county
| William Jefferson Clinton Democratic |
Robert Joseph Dole Republican |
Henry Ross Perot Reform |
Various candidates Other parties |
Margin | Total votes cast | ||||||
|---|---|---|---|---|---|---|---|---|---|---|---|
| County | # | % | # | % | # | % | # | % | # | % | # |
| Adams | 1,740 | 37.71% | 2,356 | 51.06% | 448 | 9.71% | 70 | 1.52% | -616 | -13.35% | 4,614 |
| Asotin | 3,349 | 45.81% | 2,860 | 39.12% | 936 | 12.80% | 166 | 2.27% | 489 | 6.69% | 7,311 |
| Benton | 20,783 | 38.63% | 26,664 | 49.56% | 5,311 | 9.87% | 1,045 | 1.94% | -5,881 | -10.93% | 53,803 |
| Chelan | 8,595 | 36.01% | 12,363 | 51.79% | 2,332 | 9.77% | 580 | 2.43% | -3,768 | -15.79% | 23,870 |
| Clallam | 12,585 | 42.64% | 12,432 | 42.12% | 3,187 | 10.80% | 1,312 | 4.45% | 153 | 0.52% | 29,516 |
| Clark | 52,254 | 46.35% | 46,794 | 41.51% | 9,663 | 8.57% | 4,019 | 3.57% | 5,460 | 4.84% | 112,730 |
| Columbia | 743 | 38.01% | 948 | 48.49% | 228 | 11.66% | 36 | 1.84% | -205 | -10.49% | 1,955 |
| Cowlitz | 18,054 | 53.87% | 11,221 | 33.48% | 3,441 | 10.27% | 799 | 2.38% | 6,833 | 20.39% | 33,515 |
| Douglas | 3,913 | 35.82% | 5,682 | 52.01% | 1,132 | 10.36% | 198 | 1.81% | -1,769 | -16.19% | 10,925 |
| Ferry | 1,197 | 42.49% | 1,091 | 38.73% | 408 | 14.48% | 121 | 4.30% | 106 | 3.76% | 2,817 |
| Franklin | 4,961 | 41.01% | 5,946 | 49.16% | 992 | 8.20% | 197 | 1.63% | -985 | -8.14% | 12,096 |
| Garfield | 497 | 39.60% | 623 | 49.64% | 117 | 9.32% | 18 | 1.43% | -126 | -10.04% | 1,255 |
| Grant | 8,065 | 36.88% | 10,895 | 49.83% | 2,496 | 11.41% | 410 | 1.88% | -2,830 | -12.94% | 21,866 |
| Grays Harbor | 14,082 | 53.65% | 7,635 | 29.09% | 3,757 | 14.31% | 776 | 2.96% | 6,447 | 24.56% | 26,250 |
| Island | 12,157 | 42.71% | 12,387 | 43.52% | 2,787 | 9.79% | 1,133 | 3.98% | -230 | -0.81% | 28,464 |
| Jefferson | 7,145 | 50.61% | 4,607 | 32.63% | 1,385 | 9.81% | 982 | 6.96% | 2,538 | 17.98% | 14,119 |
| King | 417,846 | 56.38% | 232,811 | 31.41% | 51,309 | 6.92% | 39,138 | 5.28% | 185,035 | 24.97% | 741,104 |
| Kitsap | 44,167 | 48.28% | 35,304 | 38.59% | 8,769 | 9.58% | 3,247 | 3.55% | 8,863 | 9.69% | 91,487 |
| Kittitas | 5,707 | 45.42% | 5,224 | 41.58% | 1,214 | 9.66% | 419 | 3.33% | 483 | 3.84% | 12,564 |
| Klickitat | 3,214 | 45.49% | 2,662 | 37.68% | 875 | 12.38% | 314 | 4.44% | 552 | 7.81% | 7,065 |
| Lewis | 10,331 | 37.37% | 13,238 | 47.89% | 3,373 | 12.20% | 702 | 2.54% | -2,907 | -10.52% | 27,644 |
| Lincoln | 1,806 | 35.88% | 2,587 | 51.40% | 518 | 10.29% | 122 | 2.42% | -781 | -15.52% | 5,033 |
| Mason | 10,088 | 48.62% | 7,149 | 34.45% | 2,816 | 13.57% | 697 | 3.36% | 2,939 | 14.16% | 20,750 |
| Okanogan | 4,810 | 36.79% | 5,890 | 45.05% | 1,797 | 13.74% | 578 | 4.42% | -1,080 | -8.26% | 13,075 |
| Pacific | 5,095 | 55.92% | 2,598 | 28.51% | 1,131 | 12.41% | 287 | 3.15% | 2,497 | 27.41% | 9,111 |
| Pend Oreille | 2,126 | 42.55% | 2,012 | 40.27% | 709 | 14.19% | 149 | 2.98% | 114 | 2.28% | 4,996 |
| Pierce | 120,893 | 50.57% | 89,295 | 37.35% | 22,051 | 9.22% | 6,834 | 2.86% | 31,598 | 13.22% | 239,073 |
| San Juan | 3,663 | 49.81% | 2,523 | 34.31% | 508 | 6.91% | 660 | 8.97% | 1,140 | 15.50% | 7,354 |
| Skagit | 18,295 | 44.49% | 16,397 | 39.88% | 4,818 | 11.72% | 1,608 | 3.91% | 1,898 | 4.62% | 41,118 |
| Skamania | 1,724 | 45.50% | 1,387 | 36.61% | 450 | 11.88% | 228 | 6.02% | 337 | 8.89% | 3,789 |
| Snohomish | 109,624 | 49.45% | 81,885 | 36.94% | 22,731 | 10.25% | 7,430 | 3.35% | 27,739 | 12.51% | 221,670 |
| Spokane | 71,727 | 45.05% | 66,628 | 41.84% | 16,532 | 10.38% | 4,345 | 2.73% | 5,099 | 3.20% | 159,232 |
| Stevens | 5,591 | 34.90% | 7,524 | 46.96% | 2,158 | 13.47% | 749 | 4.67% | -1,933 | -12.06% | 16,022 |
| Thurston | 45,522 | 52.16% | 29,835 | 34.18% | 7,622 | 8.73% | 4,301 | 4.93% | 15,687 | 17.97% | 87,280 |
| Wahkiakum | 924 | 50.33% | 619 | 33.71% | 215 | 11.71% | 78 | 4.25% | 305 | 16.61% | 1,836 |
| Walla Walla | 8,038 | 41.25% | 9,085 | 46.62% | 1,894 | 9.72% | 469 | 2.41% | -1,047 | -5.37% | 19,486 |
| Whatcom | 29,074 | 45.07% | 27,153 | 42.09% | 4,854 | 7.52% | 3,429 | 5.32% | 1,921 | 2.98% | 64,510 |
| Whitman | 7,262 | 45.69% | 6,734 | 42.37% | 1,315 | 8.27% | 584 | 3.67% | 528 | 3.32% | 15,895 |
| Yakima | 25,676 | 43.25% | 27,668 | 46.61% | 4,724 | 7.96% | 1,292 | 2.18% | -1,992 | -3.36% | 59,360 |
| Totals | 1,123,323 | 49.82% | 840,712 | 37.29% | 201,003 | 8.92% | 89,522 | 3.97% | 282,611 | 12.54% | 2,254,560 |
References
- ↑ Dave Leip’s U.S. Election Atlas; 1996 Presidential General Election Results – Washington
- ↑ Sullivan, Robert David; ‘How the Red and Blue Map Evolved Over the Past Century’; America Magazine in The National Catholic Review; June 29, 2016
See also
State results of the 1996 U.S. presidential election | ||
|---|---|---|
| Candidates | 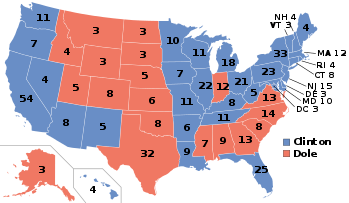 | |
| General articles | ||
| Local results |
| |
| Other 1996 elections | ||