Strafford County, New Hampshire
| Strafford County, New Hampshire | ||
|---|---|---|
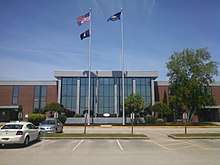 Strafford County Courthouse | ||
| ||
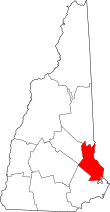 Location in the U.S. state of New Hampshire | ||
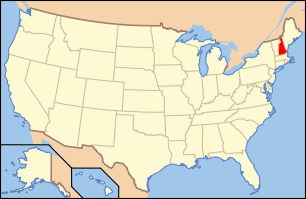 New Hampshire's location in the U.S. | ||
| Founded | 1771 | |
| Named for | William Wentworth, 2nd Earl of Strafford | |
| Seat | Dover | |
| Largest city | Dover | |
| Area | ||
| • Total | 384 sq mi (995 km2) | |
| • Land | 369 sq mi (956 km2) | |
| • Water | 15 sq mi (39 km2), 3.9% | |
| Population (est.) | ||
| • (2016) | 127,428 | |
| • Density | 334/sq mi (129/km2) | |
| Congressional district | 1st | |
| Time zone | Eastern: UTC−5/−4 | |
| Website |
www | |

Strafford County is a county in the U.S. state of New Hampshire. As of the 2010 census, the population was 123,143.[1] Its county seat is Dover.[2] Strafford County was one of the five original counties identified for New Hampshire in 1769. It was named after William Wentworth, 2nd Earl of Strafford in the mistaken belief that he was the ancestor of governor John Wentworth – although they were distantly related, William had no descendants. The county was organized at Dover in 1771. In 1840, the size of the original county was reduced with the creation of Belknap County. Strafford County constitutes a portion of the Boston-Cambridge-Newton, MA-NH Metropolitan Statistical Area as well as of the greater Boston-Worcester-Providence, MA-RI-NH-CT Combined Statistical Area.
Geography
Strafford County is in southeastern New Hampshire, separated from York County in the state of Maine by the Salmon Falls River. The southern part of the Salmon Falls, from Rollinsford to Dover, is a tidal river that flows into the Piscataqua River.
According to the U.S. Census Bureau, the county has a total area of 384 square miles (990 km2), of which 369 square miles (960 km2) is land and 15 square miles (39 km2) (3.9%) is water.[3] It is the smallest county in New Hampshire by area.
Adjacent counties
- Carroll County (north)
- York County, Maine (east)
- Rockingham County (south)
- Merrimack County (west)
- Belknap County (northwest)
Demographics
| Historical population | |||
|---|---|---|---|
| Census | Pop. | %± | |
| 1790 | 23,611 | — | |
| 1800 | 32,614 | 38.1% | |
| 1810 | 41,595 | 27.5% | |
| 1820 | 51,117 | 22.9% | |
| 1830 | 58,910 | 15.2% | |
| 1840 | 61,127 | 3.8% | |
| 1850 | 29,374 | −51.9% | |
| 1860 | 31,493 | 7.2% | |
| 1870 | 30,243 | −4.0% | |
| 1880 | 35,558 | 17.6% | |
| 1890 | 38,442 | 8.1% | |
| 1900 | 39,337 | 2.3% | |
| 1910 | 38,951 | −1.0% | |
| 1920 | 38,546 | −1.0% | |
| 1930 | 38,580 | 0.1% | |
| 1940 | 43,553 | 12.9% | |
| 1950 | 51,567 | 18.4% | |
| 1960 | 59,799 | 16.0% | |
| 1970 | 70,431 | 17.8% | |
| 1980 | 85,408 | 21.3% | |
| 1990 | 104,233 | 22.0% | |
| 2000 | 112,233 | 7.7% | |
| 2010 | 123,143 | 9.7% | |
| Est. 2016 | 127,428 | [4] | 3.5% |
| U.S. Decennial Census[5] 1790-1960[6] 1900-1990[7] 1990-2000[8] 2010-2016[1] | |||
2000 census
As of the census[9] of 2000, there were 112,233 people, 42,581 households, and 27,762 families residing in the county. The population density was 304 people per square mile (118/km²). There were 45,539 housing units at an average density of 124 per square mile (48/km²). The racial makeup of the county was 96.29% White, 0.63% Black or African American, 0.21% Native American, 1.39% Asian, 0.05% Pacific Islander, 0.30% from other races, and 1.14% from two or more races. 1.03% of the population were Hispanic or Latino of any race. 15.8% were of English, 14.9% Irish, 14.0% French, 10.5% French Canadian, 7.6% American, 6.3% Italian and 6.2% German ancestry. 93.7% spoke English and 3.2% French as their first language.
There were 42,581 households out of which 32.60% had children under the age of 18 living with them, 51.10% were married couples living together, 10.00% had a female householder with no husband present, and 34.80% were non-families. 24.80% of all households were made up of individuals and 8.20% had someone living alone who was 65 years of age or older. The average household size was 2.50 and the average family size was 2.98.
In the county, the population was spread out with 23.70% under the age of 18, 13.60% from 18 to 24, 30.60% from 25 to 44, 20.90% from 45 to 64, and 11.20% who were 65 years of age or older. The median age was 34 years. For every 100 females, there were 94.30 males. For every 100 females age 18 and over, there were 91.10 males.
The median income for a household in the county was $44,803, and the median income for a family was $53,075. Males had a median income of $36,661 versus $26,208 for females. The per capita income for the county was $20,479. About 5.00% of families and 9.20% of the population were below the poverty line, including 9.10% of those under age 18 and 6.60% of those age 65 or over.
The largest cities in Strafford County are Dover (population) and Rochester (land area) .
2010 census
As of the 2010 United States Census, there were 123,143 people, 47,100 households, and 29,862 families residing in the county.[10] The population density was 333.7 inhabitants per square mile (128.8/km2). There were 51,697 housing units at an average density of 140.1 per square mile (54.1/km2).[11] The racial makeup of the county was 93.8% white, 2.6% Asian, 1.0% black or African American, 0.2% American Indian, 0.5% from other races, and 1.9% from two or more races. Those of Hispanic or Latino origin made up 1.8% of the population.[10] In terms of ancestry, 24.4% were French or French Canadian, 19.7% were Irish, 17.4% were English, 9.5% were Italian, 8.7% were German, 5.2% were American, and 5.0% were Scottish.[12]
Of the 47,100 households, 30.6% had children under the age of 18 living with them, 48.4% were married couples living together, 10.5% had a female householder with no husband present, 36.6% were non-families, and 26.3% of all households were made up of individuals. The average household size was 2.44 and the average family size was 2.93. The median age was 36.9 years.[10]
The median income for a household in the county was $57,809 and the median income for a family was $72,286. Males had a median income of $50,489 versus $37,178 for females. The per capita income for the county was $28,059. About 6.7% of families and 11.3% of the population were below the poverty line, including 12.3% of those under age 18 and 8.0% of those age 65 or over.[13]
Politics and government
| Year | Republican | Democratic | Third parties |
|---|---|---|---|
| 2016 | 42.1% 29,072 | 50.6% 34,894 | 7.3% 5,034 |
| 2012 | 41.8% 26,729 | 56.3% 36,026 | 1.9% 1,214 |
| 2008 | 39.2% 25,021 | 59.5% 37,990 | 1.3% 837 |
| 2004 | 43.6% 25,825 | 55.6% 32,942 | 0.9% 514 |
| 2000 | 42.7% 21,108 | 51.4% 25,400 | 5.8% 2,885 |
| 1996 | 33.8% 14,484 | 54.8% 23,475 | 11.4% 4,884 |
| 1992 | 33.7% 16,028 | 44.7% 21,247 | 21.6% 10,264 |
| 1988 | 54.7% 20,636 | 43.9% 16,547 | 1.4% 515 |
| 1984 | 61.3% 20,452 | 38.2% 12,752 | 0.5% 152 |
| 1980 | 50.4% 16,399 | 33.9% 11,041 | 15.7% 5,091 |
| 1976 | 48.9% 14,569 | 48.9% 14,566 | 2.3% 680 |
| 1972 | 57.8% 16,846 | 41.3% 12,028 | 0.9% 255 |
| 1968 | 47.3% 12,427 | 50.0% 13,129 | 2.8% 727 |
| 1964 | 32.0% 8,342 | 68.0% 17,737 | |
| 1960 | 48.6% 13,539 | 51.4% 14,335 | |
| 1956 | 61.6% 15,494 | 38.4% 9,659 | 0.0% 7 |
| 1952 | 53.9% 13,729 | 46.1% 11,753 | |
| 1948 | 45.9% 9,988 | 53.3% 11,603 | 0.9% 185 |
| 1944 | 42.9% 9,388 | 57.1% 12,497 | 0.1% 13 |
| 1940 | 41.2% 8,996 | 58.8% 12,847 | |
| 1936 | 41.7% 8,215 | 55.9% 11,005 | 2.4% 477 |
| 1932 | 47.4% 9,060 | 52.2% 9,970 | 0.4% 68 |
| 1928 | 58.4% 10,470 | 41.5% 7,441 | 0.2% 28 |
| 1924 | 56.6% 9,167 | 39.8% 6,445 | 3.6% 575 |
| 1920 | 60.4% 8,700 | 39.2% 5,643 | 0.5% 69 |
| 1916 | 49.6% 4,037 | 49.6% 4,040 | 0.8% 65 |
| 1912 | 37.7% 2,962 | 44.1% 3,468 | 18.3% 1,436 |
| 1908 | 56.3% 4,822 | 41.1% 3,523 | 2.7% 228 |
| 1904 | 56.6% 4,869 | 41.3% 3,553 | 2.1% 183 |
| 1900 | 55.3% 4,987 | 42.1% 3,792 | 2.6% 236 |
| 1896 | 68.6% 5,483 | 28.3% 2,259 | 3.2% 253 |
| 1892 | 51.7% 4,666 | 46.8% 4,229 | 1.5% 134 |
| 1888 | 51.3% 4,580 | 47.8% 4,270 | 0.9% 82 |
| 1884 | 52.7% 4,370 | 45.6% 3,781 | 1.6% 135 |
| 1880 | 53.8% 4,634 | 45.5% 3,922 | 0.7% 61 |
| 1876 | 54.6% 4,052 | 45.4% 3,363 | 0.0% 1 |
County Commission
The executive power of Strafford County's government is held by three county commissioners.[15]
| Name | Hometown | Party |
|---|---|---|
| George Maglaras (Chairman) | Dover, NH | Democratic |
| Robert Watson (Vice Chairman) | Rochester, NH | Democratic |
| Deanna Rollo (Clerk) | Rollinsford, NH | Democratic |
In addition to the County Commission, there are five directly-elected officials: they include County Attorney, Register of Deeds, County Sheriff, Register of Probate, and County Treasurer.[16]
| Office | Name |
|---|---|
| County Attorney | Thomas Velardi (D) |
| Register of Deeds | Catherine Berube (D) |
| County Sheriff | David Dubois (D) |
| Register of Probate | Nancy Sirois (R) |
| County Treasurer | Pamela Arnold (D) |
Legislative branch
The legislative branch of Strafford County is made up of all of the members of the New Hampshire House of Representatives from the county. In total, as of August 2018 there are 37 members from 17 different districts.
| Affiliation | Members | Voting share | |
|---|---|---|---|
| Democratic Party | 24 | 64.9% | |
| Republican Party | 12 | 32.4% | |
| Libertarian Party | 1 | 2.7% | |
| Total | 37 | 100% | |
Communities
Cities
- Dover (county seat)
- Rochester
- Somersworth
Towns
Census-designated places
Villages
See also
Footnotes
- 1 2 "State & County QuickFacts". United States Census Bureau. Retrieved September 24, 2013.
- ↑ "Find a County". National Association of Counties. Retrieved 2011-06-07.
- ↑ "2010 Census Gazetteer Files". United States Census Bureau. August 22, 2012. Archived from the original on December 27, 2014. Retrieved December 27, 2014.
- ↑ "Population and Housing Unit Estimates". Retrieved June 9, 2017.
- ↑ "U.S. Decennial Census". United States Census Bureau. Retrieved December 27, 2014.
- ↑ "Historical Census Browser". University of Virginia Library. Retrieved December 27, 2014.
- ↑ "Population of Counties by Decennial Census: 1900 to 1990". United States Census Bureau. Retrieved December 27, 2014.
- ↑ "Census 2000 PHC-T-4. Ranking Tables for Counties: 1990 and 2000" (PDF). United States Census Bureau. Retrieved December 27, 2014.
- ↑ "American FactFinder". United States Census Bureau. Retrieved 2008-01-31.
- 1 2 3 "DP-1 Profile of General Population and Housing Characteristics: 2010 Demographic Profile Data". United States Census Bureau. Retrieved 2016-01-12.
- ↑ "Population, Housing Units, Area, and Density: 2010 - County". United States Census Bureau. Retrieved 2016-01-12.
- ↑ "DP02 SELECTED SOCIAL CHARACTERISTICS IN THE UNITED STATES – 2006-2010 American Community Survey 5-Year Estimates". United States Census Bureau. Retrieved 2016-01-12.
- ↑ "DP03 SELECTED ECONOMIC CHARACTERISTICS – 2006-2010 American Community Survey 5-Year Estimates". United States Census Bureau. Retrieved 2016-01-12.
- ↑ Leip, David. "Dave Leip's Atlas of U.S. Presidential Elections". uselectionatlas.org. Retrieved 5 April 2018.
- ↑ http://sos.nh.gov/2016CountyGen.aspx?id=8589964161
- ↑ https://www.co.strafford.nh.us/country-information/state-and-county-elected-officials
Further reading
- Robert S. Canney, The Early Marriages of Strafford County, New Hampshire. Bowie, MD: Heritage Books, 1995.
- D. Hamilton Hurd, History of Rockingham and Strafford Counties, New Hampshire: With Biographical Sketches of Many of Its Pioneers and Prominent Men. Philadelphia: J.W. Lewis, 1882.
- John Scales, History of Strafford County, New Hampshire and Representative Citizens. Chicago: Richmond-Arnold Publishing Co., 1914.
External links
Places adjacent to Strafford County, New Hampshire | ||||||||||
|---|---|---|---|---|---|---|---|---|---|---|
| ||||||||||
Municipalities and communities of Strafford County, New Hampshire, United States | ||
|---|---|---|
| Cities | | |
| Towns | ||
| CDPs | ||
| Other villages | ||