List of Parliamentary constituencies in the North East (region)
The region[1] of North East England is divided into 29 parliamentary constituencies which is made up of 19 Borough Constituencies and 10 County Constituencies. Since the General Election of June 2017[2], 26 are represented by Labour MPs, 3 by Conservative MPs, and 0 by Liberal Democrat MPs.
| North East England | |
|---|---|
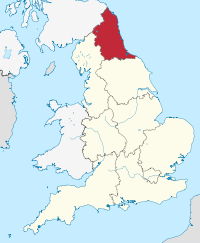 North East England region in England | |
| Sovereign state | United Kingdom |
| Country | England |
| Largest city | Newcastle upon Tyne |
| Largest town | {{{largest_town}}} |
| Government | |
| • EP constituency | North East England |
| Area | |
| • Total | 3,317 sq mi (8,592 km2) |
| Area rank | 8th |
| Population (2011) | |
| • Total | 2,597,000 |
| • Rank | 9th |
| • Density | 780/sq mi (300/km2) |
| GVA | |
| • Per capita | £15,688 (9th) |
| NUTS code | UKC |
| ONS code | E12000001 |
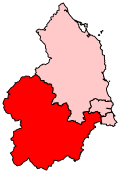
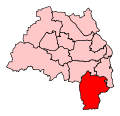
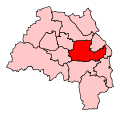
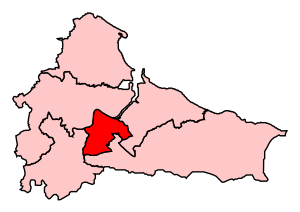
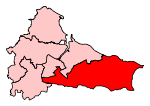
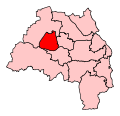
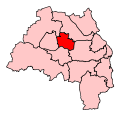
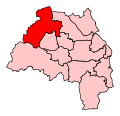
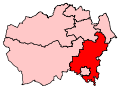
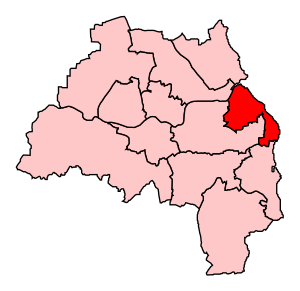
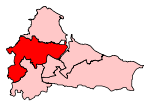
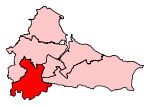
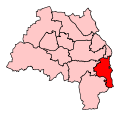
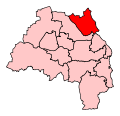
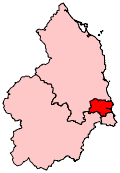
Constituencies
† Conservative ‡ Labour ¤ Liberal Democrat


See also
Notes
External links
- Politics Resources (2017 Election results)
References
- ↑ NUTS statistical regions of England - https://en.wikipedia.org/wiki/NUTS_1_statistical_regions_of_England
- ↑ 2017 Election Results - https://www.bbc.com/news/election/2017/results
- ↑ "House Of Commons Library 2017 Election report" (PDF). House Of Commons Library. 7 April 2018.
This article is issued from
Wikipedia.
The text is licensed under Creative Commons - Attribution - Sharealike.
Additional terms may apply for the media files.