Chelan County, Washington
Chelan County /ʃəˈlæn/ is a county in the U.S. state of Washington. As of the 2010 census, its population was 72,453.[1] The county seat and largest city is Wenatchee.[2] The county was created out of Okanogan and Kittitas Counties on March 13, 1899.[3][4] It derives its name from a Chelan Indian word meaning "deep water," likely a reference to 55-mile (89 km)-long Lake Chelan, which reaches a maximum depth of 1,486 feet (453 m).
Chelan County | |
|---|---|
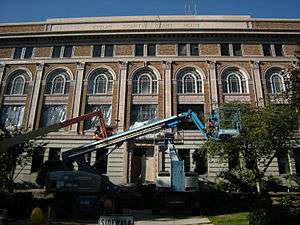 Chelan County Courthouse | |
 Seal | |
 Location within the U.S. state of Washington | |
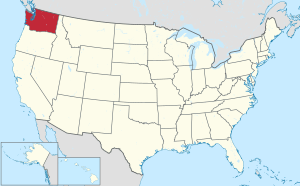 Washington's location within the U.S. | |
| Coordinates: 47°53′N 120°38′W | |
| Country | |
| State | |
| Founded | March 13, 1899 |
| Seat | Wenatchee |
| Largest city | Wenatchee |
| Area | |
| • Total | 2,994 sq mi (7,750 km2) |
| • Land | 2,921 sq mi (7,570 km2) |
| • Water | 73 sq mi (190 km2) 2.5%% |
| Population (2010) | |
| • Total | 72,453 |
| • Estimate (2019) | 77,200 |
| • Density | 26/sq mi (10/km2) |
| Time zone | UTC−8 (Pacific) |
| • Summer (DST) | UTC−7 (PDT) |
| Congressional district | 8th |
| Website | www |
Chelan County is part of the Wenatchee, Washington, Metropolitan Statistical Area.
Geography
According to the U.S. Census Bureau, the county has a total area of 2,994 square miles (7,750 km2), of which 2,921 square miles (7,570 km2) is land and 73 square miles (190 km2) (2.5%) is water.[5] It is the third-largest county in Washington by area.
Geographic features
- Bonanza Peak, highest point in Chelan County
- Cascade Mountains
- Chelan Mountains
- Chelan River
- Chiwaukum Mountains
- Columbia River
- Entiat Mountains
- Entiat River
- Lake Chelan
- Lake Wenatchee
- Stuart Range
- The Enchantments
- Wenatchee Mountains
- Wenatchee River
- Columbia River Basalt
Major highways
Adjacent counties
- Okanogan County - northeast
- Douglas County - east
- Kittitas County - south
- King County - southwest
- Snohomish County - west
- Skagit County - northwest
National protected areas
Demographics
| Historical population | |||
|---|---|---|---|
| Census | Pop. | %± | |
| 1900 | 3,931 | — | |
| 1910 | 15,104 | 284.2% | |
| 1920 | 20,906 | 38.4% | |
| 1930 | 31,634 | 51.3% | |
| 1940 | 34,412 | 8.8% | |
| 1950 | 39,301 | 14.2% | |
| 1960 | 40,744 | 3.7% | |
| 1970 | 41,355 | 1.5% | |
| 1980 | 45,061 | 9.0% | |
| 1990 | 52,250 | 16.0% | |
| 2000 | 66,616 | 27.5% | |
| 2010 | 72,453 | 8.8% | |
| Est. 2019 | 77,200 | [6] | 6.6% |
| U.S. Decennial Census[7] 1790–1960[8] 1900–1990[9] 1990–2000[10] 2010–2019[1] | |||
2000 census
As of the census[11] of 2000, there were 66,616 people, 25,021 households, and 17,364 families living in the county. The population density was 23 people per square mile (9/km²). There were 30,407 housing units at an average density of 10 per square mile (4/km²). The racial makeup of the county was 83.63% White, 0.26% Black or African American, 0.99% Native American, 0.68% Asian, 0.12% Pacific Islander, 12.19% from other races, and 2.14% from two or more races. 19.26% of the population were Hispanic or Latino of any race. 16.9% were of German, 11.2% English, 9.3% United States or American and 7.1% Irish ancestry. 80.9% spoke English and 18.1% Spanish as their first language.
There were 25,021 households out of which 34.50% had children under the age of 18 living with them, 56.40% were married couples living together, 8.70% had a female householder with no husband present, and 30.60% were non-families. 25.10% of all households were made up of individuals and 10.80% had someone living alone who was 65 years of age or older. The average household size was 2.62 and the average family size was 3.14.
In the county, the population was spread out with 28.00% under the age of 18, 8.30% from 18 to 24, 27.20% from 25 to 44, 22.70% from 45 to 64, and 13.90% who were 65 years of age or older. The median age was 36 years. For every 100 females, there were 99.10 males. For every 100 females age 18 and over, there were 96.80 males.
The median income for a household in the county was $37,316, and the median income for a family was $46,293. Males had a median income of $35,065 versus $25,838 for females. The per capita income for the county was $19,273. About 8.80% of families and 12.40% of the population were below the poverty line, including 16.00% of those under age 18 and 7.40% of those age 65 or over.
2010 census
As of the 2010 United States Census, there were 72,453 people, 27,827 households, and 18,795 families living in the county.[12] The population density was 24.8 inhabitants per square mile (9.6/km2). There were 35,465 housing units at an average density of 12.1 per square mile (4.7/km2).[13] The racial makeup of the county was 79.3% white, 1.0% American Indian, 0.8% Asian, 0.3% black or African American, 0.1% Pacific islander, 15.7% from other races, and 2.7% from two or more races. Those of Hispanic or Latino origin made up 25.8% of the population.[12] In terms of ancestry, 17.6% were German, 15.0% were American, 11.3% were English, and 8.3% were Irish.[14]
Of the 27,827 households, 32.4% had children under the age of 18 living with them, 52.7% were married couples living together, 9.7% had a female householder with no husband present, 32.5% were non-families, and 26.3% of all households were made up of individuals. The average household size was 2.57 and the average family size was 3.10. The median age was 39.3 years.[12]
The median income for a household in the county was $48,674 and the median income for a family was $57,856. Males had a median income of $41,076 versus $34,261 for females. The per capita income for the county was $24,378. About 8.2% of families and 11.5% of the population were below the poverty line, including 16.8% of those under age 18 and 9.0% of those age 65 or over.[15]
Communities

Cities
- Cashmere
- Chelan
- Entiat
- Leavenworth
- Wenatchee (county seat)
Census-designated places
Unincorporated communities
Ghost town
Politics
| Year | Republican | Democratic | Third parties |
|---|---|---|---|
| 2016 | 52.6% 18,114 | 37.9% 13,032 | 9.6% 3,287 |
| 2012 | 56.6% 18,402 | 40.4% 13,112 | 3.0% 974 |
| 2008 | 54.7% 17,605 | 42.9% 13,781 | 2.4% 777 |
| 2004 | 62.8% 18,482 | 35.6% 10,471 | 1.6% 477 |
| 2000 | 63.9% 16,980 | 31.7% 8,412 | 4.5% 1,184 |
| 1996 | 51.8% 12,363 | 36.0% 8,595 | 12.2% 2,912 |
| 1992 | 45.7% 10,716 | 33.5% 7,860 | 20.9% 4,900 |
| 1988 | 57.8% 11,601 | 40.8% 8,183 | 1.4% 281 |
| 1984 | 65.1% 13,667 | 33.2% 6,978 | 1.7% 349 |
| 1980 | 56.9% 11,299 | 32.7% 6,483 | 10.4% 2,068 |
| 1976 | 56.1% 10,492 | 40.8% 7,623 | 3.1% 577 |
| 1972 | 60.1% 10,470 | 33.8% 5,889 | 6.1% 1,054 |
| 1968 | 52.8% 9,093 | 39.4% 6,787 | 7.8% 1,350 |
| 1964 | 41.6% 7,406 | 57.8% 10,295 | 0.7% 121 |
| 1960 | 54.1% 9,854 | 44.9% 8,177 | 1.0% 183 |
| 1956 | 57.4% 10,405 | 41.9% 7,600 | 0.7% 117 |
| 1952 | 61.7% 11,164 | 38.0% 6,867 | 0.3% 53 |
| 1948 | 48.2% 7,392 | 50.2% 7,702 | 1.7% 257 |
| 1944 | 51.6% 7,081 | 47.8% 6,557 | 0.6% 75 |
| 1940 | 52.5% 8,019 | 47.0% 7,181 | 0.5% 73 |
| 1936 | 36.9% 4,975 | 59.5% 8,030 | 3.6% 481 |
| 1932 | 40.3% 5,584 | 52.8% 7,316 | 6.9% 959 |
| 1928 | 77.1% 7,672 | 22.5% 2,239 | 0.4% 43 |
| 1924 | 55.6% 4,543 | 12.2% 995 | 32.3% 2,639 |
| 1920 | 58.6% 3,885 | 23.2% 1,540 | 18.2% 1,210 |
| 1916 | 47.6% 3,011 | 43.5% 2,747 | 8.9% 563 |
| 1912 | 18.8% 970 | 25.8% 1,331 | 55.3% 2,849 |
| 1908 | 59.7% 1,639 | 31.7% 871 | 8.6% 235 |
| 1904 | 72.2% 1,248 | 21.5% 372 | 6.3% 109 |
| 1900 | 49.0% 577 | 48.6% 573 | 2.4% 28 |
See also
References
- "State & County QuickFacts". United States Census Bureau. Retrieved January 7, 2014.
- "Find a County". National Association of Counties. Archived from the original on 2011-05-31. Retrieved June 7, 2011.
- "Milestones for Washington State History — Part 2: 1851 to 1900". HistoryLink.org. 2003-03-06.
- McCormick, Ida Skarson (1999). "Links to Okanogan County, Washington". Archived from the original on May 5, 2006.
- "2010 Census Gazetteer Files". United States Census Bureau. August 22, 2012. Retrieved July 4, 2015.
- "Population and Housing Unit Estimates". Retrieved April 11, 2020.
- "U.S. Decennial Census". United States Census Bureau. Retrieved January 7, 2014.
- "Historical Census Browser". University of Virginia Library. Retrieved January 7, 2014.
- "Population of Counties by Decennial Census: 1900 to 1990". United States Census Bureau. Retrieved January 7, 2014.
- "Census 2000 PHC-T-4. Ranking Tables for Counties: 1990 and 2000" (PDF). United States Census Bureau. Retrieved January 7, 2014.
- "U.S. Census website". United States Census Bureau. Retrieved May 14, 2011.
- "DP-1 Profile of General Population and Housing Characteristics: 2010 Demographic Profile Data". United States Census Bureau. Archived from the original on February 13, 2020. Retrieved March 1, 2016.
- "Population, Housing Units, Area, and Density: 2010 - County". United States Census Bureau. Archived from the original on February 13, 2020. Retrieved March 1, 2016.
- "DP02 SELECTED SOCIAL CHARACTERISTICS IN THE UNITED STATES – 2006-2010 American Community Survey 5-Year Estimates". United States Census Bureau. Archived from the original on February 13, 2020. Retrieved March 1, 2016.
- "DP03 SELECTED ECONOMIC CHARACTERISTICS – 2006-2010 American Community Survey 5-Year Estimates". United States Census Bureau. Archived from the original on February 13, 2020. Retrieved March 1, 2016.
- Leip, David. "Dave Leip's Atlas of U.S. Presidential Elections". uselectionatlas.org. Retrieved April 5, 2018.
Further reading
- An illustrated history of Stevens, Ferry, Okanogan and Chelan counties, State of Washington. Western Historical Pub. Co. 1904.Available online through the Washington State Library's Classics in Washington History collection
External links
Places adjacent to Chelan County, Washington | ||||||||||
|---|---|---|---|---|---|---|---|---|---|---|
| ||||||||||
Municipalities and communities of Chelan County, Washington, United States | ||
|---|---|---|
| Cities | Map of Washington highlighting Chelan County | |
| CDPs | ||
| Other unincorporated communities | ||
| Indian reservation | ||
| Ghost towns | ||
| Footnotes | ‡This populated place also has portions in an adjacent county or counties | |

| Authority control |
|
|---|