Skamania County, Washington
Skamania County /skəˈmeɪniə/ is a county located in the U.S. state of Washington. As of the 2010 census, the population was 11,066.[1] The county seat and largest incorporated city is Stevenson,[2] although the Carson River Valley CDP is more populous. The county was founded in 1854 and derives its name from the Cascades Chinook word sk'mániak, meaning "swift waters".[3]
Skamania County | |
|---|---|
.jpg) Skamania County panorama | |
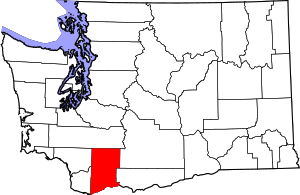 Location within the U.S. state of Washington | |
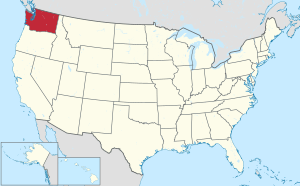 Washington's location within the U.S. | |
| Coordinates: 46°02′N 121°55′W | |
| Country | |
| State | |
| Founded | March 9, 1854 |
| Seat | Stevenson |
| Largest city | Carson River Valley |
| Area | |
| • Total | 1,683 sq mi (4,360 km2) |
| • Land | 1,656 sq mi (4,290 km2) |
| • Water | 28 sq mi (70 km2) 1.7%% |
| Population (2010) | |
| • Total | 11,066 |
| • Estimate (2019) | 12,083 |
| • Density | 7.15/sq mi (2.76/km2) |
| Time zone | UTC−8 (Pacific) |
| • Summer (DST) | UTC−7 (PDT) |
| Congressional district | 3rd |
| Website | www |
Skamania County is included in the Portland-Vancouver-Hillsboro, OR-WA Metropolitan Statistical Area.
History
The area delineated by the future Washington state boundary began to be colonized at the start of the nineteenth century, both by Americans and British subjects. However, the majority of British exploration and interest in the land was due to the fur trade, whereas American settlers were principally seeking land for agriculture and cattle raising. The Treaty of 1818 provided for the region to be an Anglo-American condominium. During this period, the future Washington Territory was divided into two administrative zones: Clark County and Lewis County (made official in 1845).
The condominium was unwieldy and led to continual argument, and occasional conflict. The status of the Washington area was settled in 1846, when the Oregon Treaty ceded the land south of North latitude 49 degrees to American control.
On March 9, 1854, Skamania County was split from the original Clark County. Also in 1854, Walla Walla County was split from the new Skamania County. After that, Skamania County retained its shape, including through the period after Washington became the 42nd state of the Union in 1889.[4] An early county seat was Fort Cascades, built to protect the Columbia River, but the county seat has been in Stevenson since 1893.
Skamania County is also known for enacting what has been described as the "Bigfoot Ordinance", passed by the Board of County Commissioners at its meeting of April 1, 1969 and published in twice in the Skamania County Pioneer, the newspaper of highest circulation in the county, as required by law. Although its passage coincided with April Fool's Day, Ordinance 69-01 was real, was amended in 1984, and has not been repealed. Its purposes included protection of residents and visitors from in the county from a very real concern, "an influx of scientific investigators as well as casual hunters, many armed with lethal weapons", who had been attracted to the area by reported sightings of a creature.[5][6][7]
On May 18, 1980, Mount St. Helens erupted.
Geography
According to the U.S. Census Bureau, the county has a total area of 1,684 square miles (4,360 km2), of which 1,656 square miles (4,290 km2) is land and 28 square miles (73 km2) (1.7%) is water.[8] 90% of Skamania is forested and 80% is a part of Gifford Pinchot National Forest.
Geographic features
Major highways

- Wind River Highway
Adjacent counties
- Lewis County - north
- Yakima County - northeast
- Klickitat County - east
- Hood River County, Oregon - south
- Multnomah County, Oregon - southwest
- Clark County - west
- Cowlitz County - west
Demographics
| Historical population | |||
|---|---|---|---|
| Census | Pop. | %± | |
| 1860 | 173 | — | |
| 1870 | 133 | −23.1% | |
| 1880 | 809 | 508.3% | |
| 1890 | 774 | −4.3% | |
| 1900 | 1,688 | 118.1% | |
| 1910 | 2,887 | 71.0% | |
| 1920 | 2,357 | −18.4% | |
| 1930 | 2,891 | 22.7% | |
| 1940 | 4,633 | 60.3% | |
| 1950 | 4,788 | 3.3% | |
| 1960 | 5,207 | 8.8% | |
| 1970 | 5,845 | 12.3% | |
| 1980 | 7,919 | 35.5% | |
| 1990 | 8,289 | 4.7% | |
| 2000 | 9,872 | 19.1% | |
| 2010 | 11,066 | 12.1% | |
| Est. 2019 | 12,083 | [9] | 9.2% |
| U.S. Decennial Census[10] 1790–1960[11] 1900–1990[12] 1990–2000[13] 2010–2019[1] | |||
2000 census
As of the census[14] of 2000, there were 9,872 people, 3,755 households, and 2,756 families living in the county. The population density was 6 people per square mile (2/km²). There were 4,576 housing units at an average density of 3 per square mile (1/km²). The racial makeup of the county was 92.11% White, 0.30% Black or African American, 2.20% Native American, 0.54% Asian, 0.17% Pacific Islander, 2.43% from other races, and 2.25% from two or more races. 4.03% of the population were Hispanic or Latino of any race. 17.7% were of German, 12.5% English, 12.1% Irish, 11.2% United States or American and 5.2% Norwegian ancestry.
There were 3,755 households out of which 34.00% had children under the age of 18 living with them, 60.50% were married couples living together, 8.20% had a female householder with no husband present, and 26.60% were non-families. 21.10% of all households were made up of individuals and 6.60% had someone living alone who was 65 years of age or older. The average household size was 2.61 and the average family size was 3.02.
In the county, the population was spread out with 26.60% under the age of 18, 6.70% from 18 to 24, 28.60% from 25 to 44, 27.10% from 45 to 64, and 11.00% who were 65 years of age or older. The median age was 39 years. For every 100 females there were 101.30 males. For every 100 females age 18 and over, there were 99.40 males.
The median income for a household in the county was $39,317, and the median income for a family was $44,586. Males had a median income of $36,732 versus $25,130 for females. The per capita income for the county was $18,002. About 10.00% of families and 13.10% of the population were below the poverty line, including 18.10% of those under age 18 and 7.90% of those age 65 or over.
There are more Seventh-day Adventists in Skamania County than members of any other religious group. Skamania County is the only county in the United States for which this is true.[15]
2010 census
As of the 2010 United States Census, there were 11,066 people, 4,522 households, and 3,072 families living in the county.[16] The population density was 6.7 inhabitants per square mile (2.6/km2). There were 5,628 housing units at an average density of 3.4 per square mile (1.3/km2).[17] The racial makeup of the county was 92.8% white, 1.6% American Indian, 0.9% Asian, 0.4% black or African American, 0.1% Pacific islander, 1.3% from other races, and 3.0% from two or more races. Those of Hispanic or Latino origin made up 5.0% of the population.[16] In terms of ancestry, 20.6% were German, 15.7% were Irish, 11.0% were English, 6.3% were Norwegian, and 5.0% were American.[18]
Of the 4,522 households, 28.4% had children under the age of 18 living with them, 54.3% were married couples living together, 8.9% had a female householder with no husband present, 32.1% were non-families, and 25.6% of all households were made up of individuals. The average household size was 2.44 and the average family size was 2.92. The median age was 44.0 years.[16]
Recreation
- There are many hiking trails throughout Skamania County in the Columbia River Gorge and the Gifford Pinchot National Forest, which includes the Mount St. Helens National Volcanic Monument. The Pacific Crest Trail passes through Skamania County.
- There are many fishing opportunities throughout Skamania County. Some of the most popular species include rainbow trout, steelhead and bass.
- The Columbia Gorge Interpretive Center Museum, in Stevenson, examines the geologic and human past in the Columbia River Gorge.
- The Lewis and Clark Expedition passed through Skamania County, and some of their campsites can be visited.
- Those interested in historic markers can visit Fort Cascades and Fort Raines, both built in the 1850s to protect the portage road around the Cascades Rapids.
- Kiteboarding and windsurfing are seasonal sports popular in the Columbia River Gorge.
Parks and other protected areas
There are many parks in Skamania County. Only a few have been listed.
County parks
- Prindle Park is a county-maintained park with picnic facilities and a playground.
- Big Cedars Campground is a county-maintained campground with primitive campsites.
- Home Valley Campground is another county-maintained camping area.
State parks
- Beacon Rock State Park offers hiking, camping, rock climbing, and picnicking facilities.
Sites maintained by the US Forest Service
- Sams Walker Day Use Site offers an interpretive trail, access to the Columbia River, and opportunities to view wildlife. Portions of it are typically wheelchair-accessible. However, vegetation growth sometimes prevents people in wheelchairs from using the trails.
- St. Cloud Day Use Site features a short, easy trail through a meadow, picnic area, access to the Columbia River and wildlife viewing opportunities.
National protected areas
- Franz Lake National Wildlife Refuge
- Gifford Pinchot National Forest (part)
- Mount St. Helens National Monument (part)
- Pierce National Wildlife Refuge
- Wind River Arboretum
- Wind River Experimental Forest
Communities
Cities
- North Bonneville
- Stevenson (county seat)
Census-designated place
- Carson
- Carson River Valley (former)
Politics
| Year | Republican | Democratic | Third parties |
|---|---|---|---|
| 2016 | 50.2% 2,928 | 38.3% 2,232 | 11.5% 669 |
| 2012 | 48.6% 2,687 | 47.5% 2,628 | 3.9% 217 |
| 2008 | 46.0% 2,524 | 51.3% 2,817 | 2.7% 149 |
| 2004 | 52.2% 2,695 | 46.0% 2,374 | 1.7% 90 |
| 2000 | 50.6% 2,151 | 41.3% 1,753 | 8.1% 345 |
| 1996 | 36.6% 1,387 | 45.5% 1,724 | 17.9% 678 |
| 1992 | 30.0% 1,102 | 40.1% 1,474 | 30.0% 1,104 |
| 1988 | 42.9% 1,356 | 55.3% 1,748 | 1.8% 58 |
| 1984 | 52.0% 1,736 | 46.5% 1,552 | 1.5% 51 |
| 1980 | 45.8% 1,416 | 44.4% 1,373 | 9.9% 306 |
| 1976 | 41.6% 1,102 | 54.2% 1,436 | 4.3% 114 |
| 1972 | 48.7% 1,288 | 43.6% 1,153 | 7.7% 204 |
| 1968 | 40.7% 968 | 51.3% 1,221 | 8.0% 191 |
| 1964 | 27.1% 653 | 72.8% 1,758 | 0.1% 3 |
| 1960 | 44.8% 1,032 | 55.0% 1,269 | 0.2% 5 |
| 1956 | 45.9% 1,014 | 54.0% 1,193 | 0.1% 2 |
| 1952 | 52.3% 1,072 | 47.7% 978 | |
| 1948 | 38.4% 707 | 57.9% 1,067 | 3.7% 68 |
| 1944 | 40.6% 668 | 58.8% 968 | 0.7% 11 |
| 1940 | 36.8% 765 | 62.2% 1,292 | 1.1% 22 |
| 1936 | 17.6% 406 | 80.7% 1,863 | 1.8% 41 |
| 1932 | 30.4% 444 | 63.9% 934 | 5.8% 84 |
| 1928 | 56.0% 631 | 42.0% 473 | 2.0% 23 |
| 1924 | 52.2% 533 | 20.3% 207 | 27.6% 282 |
| 1920 | 52.7% 409 | 31.8% 247 | 15.5% 120 |
| 1916 | 50.0% 489 | 46.1% 451 | 4.0% 39 |
| 1912 | 30.2% 251 | 31.6% 262 | 38.2% 317[20] |
| 1908 | 60.1% 310 | 27.7% 143 | 12.2% 63 |
| 1904 | 68.4% 297 | 14.1% 61 | 17.5% 76 |
| 1900 | 45.1% 175 | 52.3% 203 | 2.6% 10 |
| 1896 | 32.3% 122 | 66.7% 252 | 1.1% 4 |
| 1892 | 39.7% 91 | 43.2% 99 | 17.0% 39 |
See also
- National Register of Historic Places listings in Skamania County, Washington
References
- "State & County QuickFacts". United States Census Bureau. Retrieved January 7, 2014.
- "Find a County". National Association of Counties. Retrieved June 7, 2011.
- Bright, William (2004). Native American placenames of the United States. University of Oklahoma Press. p. 450. ISBN 978-0-8061-3598-4. Retrieved April 10, 2011.
- "Milestones for Washington State History — Part 2: 1851 to 1900". HistoryLink.org. March 6, 2003.
- "Skamania County, Washington State Bigfoot Ordinance, No. 69-01
- Joe Gisondi, Monster Trek: The Obsessive Search for Bigfoot (University of Nebraska Press, 2016)
- Courthouse Library of British Columbia
- "2010 Census Gazetteer Files". United States Census Bureau. August 22, 2012. Retrieved July 16, 2015.
- "Population and Housing Unit Estimates". Retrieved April 12, 2020.
- "U.S. Decennial Census". United States Census Bureau. Retrieved January 7, 2014.
- "Historical Census Browser". University of Virginia Library. Retrieved January 7, 2014.
- "Population of Counties by Decennial Census: 1900 to 1990". United States Census Bureau. Retrieved January 7, 2014.
- "Census 2000 PHC-T-4. Ranking Tables for Counties: 1990 and 2000" (PDF). United States Census Bureau. Retrieved January 7, 2014.
- "U.S. Census website". United States Census Bureau. Retrieved May 14, 2011.
- "Archived copy". Archived from the original on February 18, 2011. Retrieved February 5, 2011.CS1 maint: archived copy as title (link)
- "Profile of General Population and Housing Characteristics: 2010 Demographic Profile Data". United States Census Bureau. Archived from the original on February 13, 2020. Retrieved March 6, 2016.
- "Population, Housing Units, Area, and Density: 2010 - County". United States Census Bureau. Archived from the original on February 13, 2020. Retrieved March 6, 2016.
- "Selected Social Characteristics in the United States – 2006-2010 American Community Survey 5-Year Estimates". United States Census Bureau. Archived from the original on February 13, 2020. Retrieved March 6, 2016.
- Leip, David. "Dave Leip's Atlas of U.S. Presidential Elections". uselectionatlas.org. Retrieved April 10, 2018.
- The leading "other" candidate, Progressive Theodore Roosevelt, received 218 votes, while Socialist candidate Eugene Debs received 86 votes, Prohibition candidate Eugene Chafin received 10 votes, and Socialist Labor candidate Arthur Reimer received 3 votes.
Places adjacent to Skamania County, Washington | ||||||||||
|---|---|---|---|---|---|---|---|---|---|---|
| ||||||||||
Municipalities and communities of Skamania County, Washington, United States | ||
|---|---|---|
| Cities | Map of Washington highlighting Skamania County | |
| CDP | ||
| Unincorporated communities | ||

| Authority control |
|
|---|