Walla Walla County, Washington
Walla Walla County is a county located in the U.S. state of Washington. As of the 2010 census, its population was 58,781.[1] The county seat and largest city is Walla Walla.[2] The county was formed on April 25, 1854[3] and is named after the Walla Walla tribe of Native Americans.
Walla Walla County | |
|---|---|
 Postcard. Walla Walla Court House in 1906. | |
 Seal | |
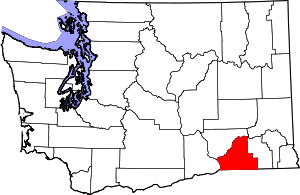 Location within the U.S. state of Washington | |
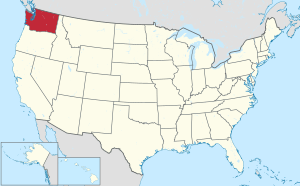 Washington's location within the U.S. | |
| Coordinates: 46°14′N 118°29′W | |
| Country | |
| State | |
| Founded | April 25, 1854 |
| Named for | Walla Walla people |
| Seat | Walla Walla |
| Largest city | Walla Walla |
| Area | |
| • Total | 1,299 sq mi (3,360 km2) |
| • Land | 1,270 sq mi (3,300 km2) |
| • Water | 29 sq mi (80 km2) 2.2%% |
| Population (2010) | |
| • Total | 58,781 |
| • Estimate (2019) | 60,760 |
| • Density | 46/sq mi (17.8/km2) |
| Time zone | UTC−8 (Pacific) |
| • Summer (DST) | UTC−7 (PDT) |
| Congressional districts | 4th, 5th |
| Website | www |
Walla Walla County is included in the Walla Walla, WA Metropolitan Statistical Area.
Geography
According to the U.S. Census Bureau, the county has a total area of 1,299 square miles (3,360 km2), of which 1,270 square miles (3,300 km2) is land and 29 square miles (75 km2) (2.2%) is water.[4]
Geographic features
- Columbia River
- Snake River
- Blue Mountains
- Touchet River
- Ponderosa Pines
- Banana Belt
- Walla Walla River
Major highways

Adjacent counties
- Columbia County - east
- Umatilla County, Oregon - south
- Benton County - west
- Franklin County - northwest
National protected areas
Demographics
| Historical population | |||
|---|---|---|---|
| Census | Pop. | %± | |
| 1860 | 1,318 | — | |
| 1870 | 5,300 | 302.1% | |
| 1880 | 8,716 | 64.5% | |
| 1890 | 12,224 | 40.2% | |
| 1900 | 18,680 | 52.8% | |
| 1910 | 31,931 | 70.9% | |
| 1920 | 27,539 | −13.8% | |
| 1930 | 28,441 | 3.3% | |
| 1940 | 30,547 | 7.4% | |
| 1950 | 40,135 | 31.4% | |
| 1960 | 42,195 | 5.1% | |
| 1970 | 42,176 | 0.0% | |
| 1980 | 47,435 | 12.5% | |
| 1990 | 48,439 | 2.1% | |
| 2000 | 55,180 | 13.9% | |
| 2010 | 58,781 | 6.5% | |
| Est. 2019 | 60,760 | [5] | 3.4% |
| U.S. Decennial Census[6] 1790–1960[7] 1900–1990[8] 1990–2000[9] 2010–2019[1] | |||
2000 census
As of the census[10] of 2000, there were 55,180 people, 19,647 households, and 13,242 families living in the county. The population density was 43 people per square mile (17/km²). There were 21,147 housing units at an average density of 17 per square mile (6/km²). The racial makeup of the county was 85.32% White, 1.69% Black or African American, 0.84% Native American, 1.11% Asian, 0.22% Pacific Islander, 8.24% from other races, and 2.57% from two or more races. 15.68% of the population were Hispanic or Latino of any race. 20.1% were of German, 10.7% English, 7.7% United States or American and 7.3% Irish ancestry.
There were 19,647 households out of which 32.10% had children under the age of 18 living with them, 54.00% were married couples living together, 9.50% had a female householder with no husband present, and 32.60% were non-families. 27.10% of all households were made up of individuals and 12.40% had someone living alone who was 65 years of age or older. The average household size was 2.54 and the average family size was 3.08.
In the county, the population was spread out with 24.60% under the age of 18, 13.40% from 18 to 24, 26.50% from 25 to 44, 20.80% from 45 to 64, and 14.80% who were 65 years of age or older. The median age was 35 years. For every 100 females there were 103.80 males. For every 100 females age 18 and over, there were 102.90 males.
The median income for a household in the county was $35,900, and the median income for a family was $44,962. Males had a median income of $34,691 versus $24,736 for females. The per capita income for the county was $16,509. About 10.20% of families and 15.10% of the population were below the poverty line, including 18.80% of those under age 18 and 8.20% of those age 65 or over.
2010 census
As of the 2010 United States Census, there were 58,781 people, 21,719 households, and 14,132 families living in the county.[11] The population density was 46.3 inhabitants per square mile (17.9/km2). There were 23,451 housing units at an average density of 18.5 per square mile (7.1/km2).[12] The racial makeup of the county was 84.5% white, 1.8% black or African American, 1.3% Asian, 1.0% American Indian, 0.3% Pacific islander, 8.0% from other races, and 3.1% from two or more races. Those of Hispanic or Latino origin made up 19.7% of the population.[11] In terms of ancestry, 23.5% were German, 13.3% were English, 12.7% were Irish, and 6.6% were American.[13]
Of the 21,719 households, 30.8% had children under the age of 18 living with them, 50.1% were married couples living together, 10.5% had a female householder with no husband present, 34.9% were non-families, and 28.2% of all households were made up of individuals. The average household size was 2.50 and the average family size was 3.05. The median age was 36.7 years.[11]
The median income for a household in the county was $45,575 and the median income for a family was $55,773. Males had a median income of $42,704 versus $35,586 for females. The per capita income for the county was $23,027. About 12.4% of families and 17.5% of the population were below the poverty line, including 24.6% of those under age 18 and 9.2% of those age 65 or over.[14]
Communities
Cities
- College Place
- Prescott
- Waitsburg
- Walla Walla (county seat)
Politics
| Year | Republican | Democratic | Third parties |
|---|---|---|---|
| 2016 | 52.1% 13,651 | 37.0% 9,694 | 11.0% 2,883 |
| 2012 | 57.9% 14,648 | 38.6% 9,768 | 3.5% 882 |
| 2008 | 57.0% 14,182 | 40.5% 10,081 | 2.5% 614 |
| 2004 | 62.5% 14,323 | 36.0% 8,257 | 1.5% 345 |
| 2000 | 62.3% 13,304 | 33.6% 7,188 | 4.1% 873 |
| 1996 | 46.6% 9,085 | 41.3% 8,038 | 12.1% 2,363 |
| 1992 | 39.7% 7,894 | 36.8% 7,325 | 23.5% 4,662 |
| 1988 | 55.6% 9,683 | 42.8% 7,448 | 1.6% 272 |
| 1984 | 63.7% 12,361 | 35.1% 6,804 | 1.2% 233 |
| 1980 | 59.1% 11,223 | 30.7% 5,825 | 10.2% 1,929 |
| 1976 | 59.2% 10,883 | 38.1% 7,012 | 2.7% 505 |
| 1972 | 67.9% 12,579 | 28.9% 5,364 | 3.2% 590 |
| 1968 | 59.3% 10,042 | 34.5% 5,841 | 6.1% 1,040 |
| 1964 | 46.1% 8,102 | 53.9% 9,481 | 0.1% 11 |
| 1960 | 63.6% 11,786 | 36.3% 6,721 | 0.1% 12 |
| 1956 | 66.0% 11,827 | 33.9% 6,076 | 0.0% 7 |
| 1952 | 67.3% 11,987 | 32.2% 5,738 | 0.5% 92 |
| 1948 | 52.0% 7,993 | 46.2% 7,102 | 1.8% 283 |
| 1944 | 55.6% 7,364 | 43.8% 5,793 | 0.6% 78 |
| 1940 | 57.0% 7,883 | 42.5% 5,875 | 0.5% 63 |
| 1936 | 39.3% 4,584 | 56.2% 6,562 | 4.5% 524 |
| 1932 | 44.0% 4,653 | 52.8% 5,578 | 3.3% 344 |
| 1928 | 70.1% 6,774 | 29.6% 2,859 | 0.3% 33 |
| 1924 | 58.8% 5,465 | 17.9% 1,662 | 23.3% 2,163 |
| 1920 | 67.6% 5,957 | 26.5% 2,338 | 5.9% 517 |
| 1916 | 48.0% 4,429 | 48.3% 4,456 | 3.7% 342 |
| 1912 | 25.3% 1,937 | 32.7% 2,507 | 42.0% 3,219 |
| 1908 | 60.7% 2,843 | 35.5% 1,660 | 3.8% 178 |
| 1904 | 72.0% 2,824 | 24.4% 956 | 3.7% 143 |
| 1900 | 57.4% 2,119 | 40.1% 1,480 | 2.4% 90 |
| 1896 | 47.6% 1,596 | 51.2% 1,716 | 1.2% 39 |
| 1892 | 47.1% 1,362 | 45.5% 1,313 | 7.4% 214 |
Walla Walla County is generally Republican; it has voted for that party in all but one presidential election since 1940, and has voted Democratic just five times since Washington’s statehood in 1889. Like the state as a whole, third-party candidates often receive a larger share of the vote than they do nationally. The county is part of Washington's 5th congressional district, which is represented by Republican Cathy McMorris Rodgers.
Footnotes
- "State & County QuickFacts". United States Census Bureau. Retrieved January 8, 2014.
- "Find a County". National Association of Counties. Retrieved June 7, 2011.
- "Milestones for Washington State History — Part 2: 1851 to 1900". HistoryLink.org. March 6, 2003.
- "2010 Census Gazetteer Files". United States Census Bureau. August 22, 2012. Retrieved July 16, 2015.
- "Population and Housing Unit Estimates". Retrieved April 11, 2020.
- "U.S. Decennial Census". United States Census Bureau. Retrieved January 8, 2014.
- "Historical Census Browser". University of Virginia Library. Retrieved January 8, 2014.
- "Population of Counties by Decennial Census: 1900 to 1990". United States Census Bureau. Retrieved January 8, 2014.
- "Census 2000 PHC-T-4. Ranking Tables for Counties: 1990 and 2000" (PDF). United States Census Bureau. Retrieved January 8, 2014.
- "U.S. Census website". United States Census Bureau. Retrieved May 14, 2011.
- "DP-1 Profile of General Population and Housing Characteristics: 2010 Demographic Profile Data". United States Census Bureau. Archived from the original on February 13, 2020. Retrieved March 6, 2016.
- "Population, Housing Units, Area, and Density: 2010 - County". United States Census Bureau. Archived from the original on February 13, 2020. Retrieved March 6, 2016.
- "DP02 SELECTED SOCIAL CHARACTERISTICS IN THE UNITED STATES – 2006-2010 American Community Survey 5-Year Estimates". United States Census Bureau. Archived from the original on 2020-02-13. Retrieved March 6, 2016.
- "DP03 SELECTED ECONOMIC CHARACTERISTICS – 2006-2010 American Community Survey 5-Year Estimates". United States Census Bureau. Archived from the original on February 13, 2020. Retrieved March 6, 2016.
- Leip, David. "Dave Leip's Atlas of U.S. Presidential Elections". uselectionatlas.org. Retrieved April 10, 2018.
Further reading
- Frank T. Gilbert, Historic Sketches: Walla Walla, Columbia and Garfield Counties, Washington Territory. Portland, OR: A.G. Walling Printing House, 1882.
- W.D. Lyman, Lyman's History of Old Walla Walla County, Embracing Walla Walla, Columbia, Garfield and Asotin Counties. In Two Volumes. Chicago: S.J. Clarke Publishing Co., 1918. Volume 1 | Volume 2
- Frederic Ambrose Shaver, An Illustrated History of Southeastern Washington, Including Walla Walla, Columbia, Garfield and Asotin Counties, Washington. Spokane, WA: Western Historical Publishing Co., 1906.
External links
- Walla Walla Washington at HistoryLink.org
- Walla Walla photographs collection at the Whitman College and Northwest Archives, Whitman College.
Places adjacent to Walla Walla County, Washington | ||||||||||
|---|---|---|---|---|---|---|---|---|---|---|
| ||||||||||
Municipalities and communities of Walla Walla County, Washington, United States | ||
|---|---|---|
| Cities | Map of Washington highlighting Walla Walla County | |
| CDPs | ||
| Unincorporated communities | ||
| Ghost towns | ||

| Authority control |
|
|---|