Greenwood County, South Carolina
Greenwood County is a county located in the U.S. state of South Carolina. As of the 2010 census, its population was 69,661.[1] Its county seat is Greenwood.[2]
Greenwood County | |
|---|---|
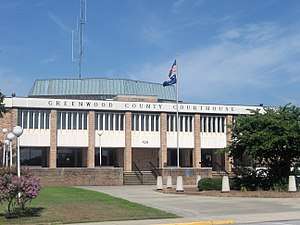 Greenwood County Courthouse | |
 Seal | |
 Location within the U.S. state of South Carolina | |
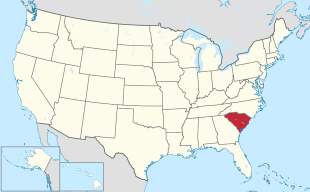 South Carolina's location within the U.S. | |
| Coordinates: 34°10′N 82°08′W | |
| Country | |
| State | |
| Founded | 1897 |
| Seat | Greenwood |
| Largest city | Greenwood |
| Area | |
| • Total | 463 sq mi (1,200 km2) |
| • Land | 455 sq mi (1,180 km2) |
| • Water | 8.2 sq mi (21 km2) 1.8%% |
| Population (2010) | |
| • Total | 69,661 |
| • Estimate (2018) | 70,741 |
| • Density | 150/sq mi (58/km2) |
| Time zone | UTC−5 (Eastern) |
| • Summer (DST) | UTC−4 (EDT) |
| Congressional district | 3rd |
| Website | www |
Greenwood County is coterminous with the Greenwood, SC, Micropolitan Statistical Area.[3]
History
The arrival of the railroad in 1852 stimulated cotton growing and textile manufacturing in this area.
The rise of textile manufacturing in the New South altered the economy and society of the region. The first cotton mill in Greenwood opened in 1890 with 75 workers. When it nearly failed in 1908, James C. Self became president of Greenwood Cotton Mill and built one of the largest privately-held companies in the industry. Abney Mills, based in Greenwood, spread its production plants across the upstate.
Greenwood County was formed in 1897 from portions of Abbeville and Edgefield counties, which had originally been part of the old Ninety-Six District. It was named for its county seat, Greenwood. This had been named around 1824 after a plantation owned by John McGehee, an early resident. The area was developed largely for cotton plantations and was dependent on slave labor. It has continued to be agricultural in the 21st century.
Greenwood County was the site of the November 1898 Phoenix Election riot.
The Great Depression altered the economy and landscape of Greenwood County. Farmers were impoverished, land values declined, local textile mills struggled to survive and to resist union efforts to organize the workers. After 1933, New Deal programs offered limited work relief for the unemployed. The largest New Deal project in the area was construction of Buzzard's Roost Dam on the Saluda River to impound Lake Greenwood and generate electricity in a county-owned power plant. Today the hydroelectric plant has been sold to Duke Power Company while the lake offers an array of recreational facilities.
Since 1950, Greenwood County has experienced diversified industrial growth with construction of new factories by major corporations such as Monsanto (Ascend), Velux, Capsugel (Lonza) and Fujifilm.[4]
Geography
According to the U.S. Census Bureau, the county has a total area of 463 square miles (1,200 km2), of which 455 square miles (1,180 km2) is land and 8.2 square miles (21 km2) (1.8%) is water.[5] Greenwood County is in the Savannah River basin and the Saluda River basin.
Adjacent counties
- Laurens County - north
- Newberry County - northeast
- Edgefield County - southeast
- Saluda County - southeast
- McCormick County - southwest
- Abbeville County - west
National protected areas
Demographics
| Historical population | |||
|---|---|---|---|
| Census | Pop. | %± | |
| 1900 | 28,343 | — | |
| 1910 | 34,225 | 20.8% | |
| 1920 | 35,791 | 4.6% | |
| 1930 | 36,078 | 0.8% | |
| 1940 | 40,083 | 11.1% | |
| 1950 | 41,628 | 3.9% | |
| 1960 | 44,346 | 6.5% | |
| 1970 | 49,686 | 12.0% | |
| 1980 | 57,847 | 16.4% | |
| 1990 | 59,567 | 3.0% | |
| 2000 | 66,271 | 11.3% | |
| 2010 | 69,661 | 5.1% | |
| Est. 2018 | 70,741 | [6] | 1.6% |
| U.S. Decennial Census[7] 1790-1960[8] 1900-1990[9] 1990-2000[10] 2010-2013[1] | |||
2000 census
As of the census[11] of 2000, there were 66,271 people, 25,729 households, and 17,753 families living in the county. The population density was 146 people per square mile (56/km²). There were 28,243 housing units at an average density of 62 per square mile (24/km²). The racial makeup of the county was 65.57% White, 31.74% Black or African American, 0.18% Native American, 0.71% Asian, 0.04% Pacific Islander, 1.03% from other races, and 0.74% from two or more races. 2.87% of the population were Hispanic or Latino of any race.
There were 25,729 households out of which 31.70% had children under the age of 18 living with them, 48.70% were married couples living together, 16.10% had a female householder with no husband present, and 31.00% were non-families. 26.30% of all households were made up of individuals and 10.60% had someone living alone who was 65 years of age or older. The average household size was 2.49 and the average family size was 3.00.
In the county, the population was spread out with 25.50% under the age of 18, 10.40% from 18 to 24, 28.20% from 25 to 44, 22.20% from 45 to 64, and 13.70% who were 65 years of age or older. The median age was 35 years. For every 100 females there were 88.40 males. For every 100 females age 18 and over, there were 84.60 males.
The median income for a household in the county was $34,702, and the median income for a family was $42,022. Males had a median income of $30,759 versus $23,820 for females. The per capita income for the county was $17,446. About 9.90% of families and 14.20% of the population were below the poverty line, including 17.70% of those under age 18 and 14.10% of those age 65 or over.
2010 census
As of the 2010 United States Census, there were 69,661 people, 27,547 households, and 18,438 families living in the county.[12] The population density was 153.2 inhabitants per square mile (59.2/km2). There were 31,054 housing units at an average density of 68.3 per square mile (26.4/km2).[13] The racial makeup of the county was 62.9% white, 31.4% black or African American, 0.8% Asian, 0.3% American Indian, 3.5% from other races, and 1.2% from two or more races. Those of Hispanic or Latino origin made up 5.4% of the population.[12] In terms of ancestry, 17.8% were American, 8.7% were English, 8.2% were Irish, and 8.0% were German.[14]
Of the 27,547 households, 32.9% had children under the age of 18 living with them, 44.4% were married couples living together, 17.5% had a female householder with no husband present, 33.1% were non-families, and 27.9% of all households were made up of individuals. The average household size was 2.43 and the average family size was 2.96. The median age was 37.9 years.[12]
The median income for a household in the county was $38,797 and the median income for a family was $49,785. Males had a median income of $36,806 versus $29,327 for females. The per capita income for the county was $21,728. About 12.8% of families and 17.6% of the population were below the poverty line, including 27.3% of those under age 18 and 9.7% of those age 65 or over.[15]
Economy
Greenwood County boasts a modern and diverse economic base, from Fujifilm’s North American manufacturing, distribution, and research and development headquarters to nationally recognized genetics research at the Greenwood Genetic Center. Approximately 26% of the local workforce is dedicated to manufacturing.[16][17]
In 2015, the median household income in Greenwood County, SC was $37,060, a 2.82% growth from the previous year. Also in 2015 there were 28,506 residents in Greenwood County, SC with jobs, a 1.03% growth over 2014.
The most common employment sectors for those who live in Greenwood County, SC, are Manufacturing, Healthcare & Social Assistance, and Retail trade.[18]
he overall cost of living index in Greenwood County, SC, is 83, which is 13% lower than the South Carolina average and 17% lower than the national average. The cost of living index is created from the following categories: goods/services (33%), groceries (13%), health care (5%), housing (30%), transportation (9%) and utilities (10%). Everyday goods and services can be a good indicator of the general cost of goods in a given city. In this case, the goods and services in Greenwood, SC, are 7% lower than the South Carolina average and 6% lower than the national average.[19]
Major employers in Greenwood County include Self Regional Healthcare, Greenwood County School Districts, Eaton Corporation, FujiFilm Manufacturing, U.S.A., Carolina Pride, Capsugel, Lander University, Piedmont Technical College, Cardinal Health, Ascend Performance Materials, and VELUX.[20]
Major existing industry clusters include Life Sciences, Food Processing, Advance Materials, and Wood Products.
The per capita personal income in Greenwood County, SC as of 2015 was $33,723.[21] The Unemployment rate in Greenwood County, SC was 4.0% as of Sept 2017.[22] The median household income in Greenwood County was $42,240 as of 2015.[23]
Government and infrastructure
Leath Correctional Institution, a South Carolina Department of Corrections prison for women, is located in unincorporated Greenwood County, near Greenwood.[24]
Politics
| Year | Republican | Democratic | Third parties |
|---|---|---|---|
| 2016 | 59.0% 16,961 | 37.2% 10,711 | 3.8% 1,091 |
| 2012 | 57.0% 16,348 | 41.8% 11,972 | 1.2% 352 |
| 2008 | 57.3% 16,995 | 41.6% 12,348 | 1.1% 324 |
| 2004 | 60.9% 14,264 | 38.2% 8,954 | 1.0% 224 |
| 2000 | 58.5% 12,193 | 39.0% 8,139 | 2.5% 528 |
| 1996 | 48.8% 8,865 | 45.1% 8,193 | 6.1% 1,105 |
| 1992 | 48.0% 9,079 | 40.3% 7,621 | 11.7% 2,223 |
| 1988 | 57.9% 9,096 | 41.5% 6,511 | 0.6% 97 |
| 1984 | 62.9% 10,887 | 36.6% 6,339 | 0.5% 81 |
| 1980 | 43.2% 7,290 | 55.0% 9,283 | 1.9% 315 |
| 1976 | 37.4% 5,974 | 62.4% 9,976 | 0.3% 41 |
| 1972 | 72.2% 9,370 | 26.2% 3,400 | 1.6% 205 |
| 1968 | 33.4% 4,891 | 25.5% 3,741 | 41.1% 6,026 |
| 1964 | 50.8% 5,653 | 49.2% 5,479 | |
| 1960 | 36.0% 2,968 | 64.0% 5,283 | |
| 1956 | 16.6% 1,120 | 65.0% 4,386 | 18.5% 1,247 |
| 1952 | 47.1% 3,392 | 52.9% 3,815 | |
| 1948 | 2.1% 63 | 14.6% 440 | 83.3% 2,511 |
| 1944 | 2.6% 71 | 88.6% 2,381 | 8.7% 234 |
| 1940 | 1.3% 39 | 98.7% 2,914 | |
| 1936 | 0.6% 19 | 99.4% 3,064 | |
| 1932 | 0.5% 15 | 99.5% 3,240 | |
| 1928 | 1.3% 38 | 98.7% 2,921 | |
| 1924 | 0.8% 15 | 99.0% 1,815 | 0.2% 4 |
| 1920 | 1.0% 15 | 99.1% 1,568 | |
| 1916 | 0.8% 13 | 98.9% 1,636 | 0.3% 5 |
| 1912 | 1.3% 17 | 97.7% 1,307 | 1.0% 14 |
| 1904 | 0.1% 1 | 99.9% 1,332 | |
| 1900 | 0.3% 4 | 99.7% 1,482 |
Education
Greenwood County has three school districts: Greenwood School District 50 (Greenwood Metro), Greenwood School District 51 (Ware Shoals), and Greenwood School District 52 (Ninety Six).
School districts
- Greenwood School District 50 serves families in the Greenwood metro area. This school system consists of 8 elementary schools, 3 middle schools, 2 high schools, a career center, and an adult education center. The current superintendent of District 50 is Dr. Darrell Johnson.
- Greenwood School District 51 serves families in the town of Ware Shoals, as well as students from surrounding areas of Greenwood, Abbeville, and Laurens counties. Two of the three schools are located in the town limits of Ware Shoals (Greenwood County) while the other school is located in Laurens County.
- Greenwood School District 52 serves families in the town of Ninety Six and surrounding areas of Greenwood County.
Elementary schools
- Hodges Elementary School (K-5)
- Lakeview Elementary School(K4-5)
- Mathews Elementary School (K4-5)
- Merrywood Elementary School (K4-5)
- Ninety Six Elementary School (3-5)
- Ninety Six Primary School (K4-2)
- Pinecrest Elementary School (K4-5)
- Rice Elementary School (K4-5)
- Springfield Elementary School (K4-5)
- Ware Shoals Elementary School (4-6)
- Ware Shoals Primary School (PreK-3)
- Woodfields Elementary School (K4-5)
Middle schools
- Brewer Middle School (6-8)
- Edgewood Middle School (6-8)
- Northside Middle School (6-8)
- Westview Middle School (6-8)
High schools
- Emerald High School (9-12)
- Greenwood High School (9-12)
- Ninety Six High School (9-12)
- Ware Shoals High School (7-12)
Higher education
- Lander University (4-Year State Supported Liberal Arts University)
- Piedmont Technical College
Alternate education centers
- G. Frank Russell Career Center (9-12)
- Genesis Education Center (7-12) and Adult Education
Communities
City
- Greenwood (county seat)
Towns
- Hodges
- Ninety Six
- Troy
- Ware Shoals (partly in Abbeville and Laurens Counties)
Census-designated places
Unincorporated communities
- Callison
- Kirksey
- Pittsburg
See also
References
- "State & County QuickFacts". United States Census Bureau. Archived from the original on June 6, 2011. Retrieved November 22, 2013.
- "Find a County". National Association of Counties. Archived from the original on 2011-05-31. Retrieved 2011-06-07.
- "OMB Bulletin No. 18-04: Revised Delineations of Metropolitan Statistical Areas, Micropolitan Statistical Areas, and Combined Statistical Areas, and Guidance on Uses of the Delineations of These Areas" (PDF). United States Office of Management and Budget. September 14, 2018. Retrieved June 21, 2019.
- "Greenwood County, South Carolina". www.carolana.com. Retrieved 2017-11-30.
- "2010 Census Gazetteer Files". United States Census Bureau. August 22, 2012. Retrieved March 17, 2015.
- "Population and Housing Unit Estimates". Retrieved July 30, 2019.
- "U.S. Decennial Census". United States Census Bureau. Retrieved March 17, 2015.
- "Historical Census Browser". University of Virginia Library. Retrieved March 17, 2015.
- Forstall, Richard L., ed. (March 27, 1995). "Population of Counties by Decennial Census: 1900 to 1990". United States Census Bureau. Retrieved March 17, 2015.
- "Census 2000 PHC-T-4. Ranking Tables for Counties: 1990 and 2000" (PDF). United States Census Bureau. April 2, 2001. Retrieved March 17, 2015.
- "U.S. Census website". United States Census Bureau. Retrieved 2011-05-14.
- "DP-1 Profile of General Population and Housing Characteristics: 2010 Demographic Profile Data". United States Census Bureau. Archived from the original on 2020-02-13. Retrieved 2016-03-09.
- "Population, Housing Units, Area, and Density: 2010 - County". United States Census Bureau. Archived from the original on 2020-02-13. Retrieved 2016-03-09.
- "DP02 SELECTED SOCIAL CHARACTERISTICS IN THE UNITED STATES – 2006-2010 American Community Survey 5-Year Estimates". United States Census Bureau. Archived from the original on 2020-02-13. Retrieved 2016-03-09.
- "DP03 SELECTED ECONOMIC CHARACTERISTICS – 2006-2010 American Community Survey 5-Year Estimates". United States Census Bureau. Archived from the original on 2020-02-13. Retrieved 2016-03-09.
- "Greenwood Partnership Alliance | Workforce | Greenwood, SC". www.partnershipalliance.com. Retrieved 2017-11-30.
- "Greenwood Genetic - Birth Defects | Diagnostic Services | Treatments | Prevention Programs". www.ggc.org. Retrieved 2017-11-30.
- "Greenwood County, SC". Data USA. Retrieved 2017-11-30.
- "Greenwood Partnership Alliance | Operational Advantages | Greenwood, SC". www.partnershipalliance.com. Retrieved 2017-11-30.
- "Greenwood Partnership Alliance | Major Employers | Greenwood, SC". www.partnershipalliance.com. Retrieved 2017-11-30.
- "Per Capita Personal Income in Greenwood County, SC". 2017-03-10. Cite journal requires
|journal=(help) - "Unemployment Rate in Greenwood County, SC". 2017-11-01. Cite journal requires
|journal=(help) - "Estimate of Median Household Income for Greenwood County, SC". 2017-06-27. Cite journal requires
|journal=(help) - "Leath Correctional Institution." South Carolina Department of Corrections. Retrieved on August 17, 2010.
- Leip, David. "Dave Leip's Atlas of U.S. Presidential Elections". uselectionatlas.org. Retrieved 2018-03-13.
External links
- Official Greenwood County website

Places adjacent to Greenwood County, South Carolina | ||||||||||
|---|---|---|---|---|---|---|---|---|---|---|
| ||||||||||
Municipalities and communities of Greenwood County, South Carolina, United States | ||
|---|---|---|
| City | Map of South Carolina highlighting Greenwood County | |
| Towns | ||
| CDPs | ||
| Unincorporated community | ||
| Footnotes | ‡This populated place also has portions in an adjacent county or counties | |
| Authority control |
|
|---|