Colleton County, South Carolina
Colleton County is a county located in the Lowcountry region of the U.S. state of South Carolina. As of the 2010 census, its population was 38,892.[1] Its county seat is Walterboro.[2] The county is named after Sir John Colleton, 1st Baronet,[3] one of the eight Lords Proprietor of the Province of Carolina. After two previous incarnations, the current Colleton County was created in 1800.[4]
Colleton County | |
|---|---|
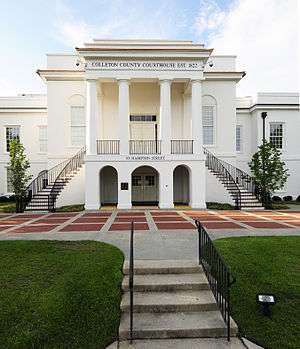 Colleton County Courthouse | |
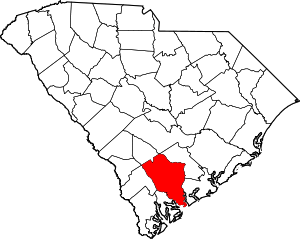 Location within the U.S. state of South Carolina | |
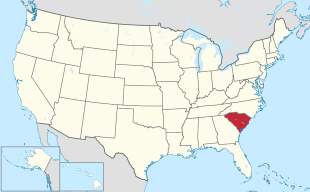 South Carolina's location within the U.S. | |
| Coordinates: 32°50′N 80°39′W | |
| Country | |
| State | |
| Founded | 1800 |
| Named for | Sir John Colleton, 1st Baronet |
| Seat | Walterboro |
| Largest city | Walterboro |
| Area | |
| • Total | 1,133 sq mi (2,930 km2) |
| • Land | 1,056 sq mi (2,740 km2) |
| • Water | 77 sq mi (200 km2) 6.8% |
| Population (2010) | |
| • Total | 38,892 |
| • Estimate (2018) | 37,660 |
| • Density | 33/sq mi (13/km2) |
| Time zone | UTC−5 (Eastern) |
| • Summer (DST) | UTC−4 (EDT) |
| Congressional districts | 1st, 6th |
| Website | www |
History
In 1682, Colleton was created as one of the three original proprietary counties, located in the southwestern coastal portion of the new South Carolina Colony and bordering on the Combahee River.
In 1706, the county was divided between the new Saint Bartholomew and Saint Paul parishes. This area was developed for large plantations devoted to rice and indigo cultivation as commodity crops. The planters depended on the labor of African slaves transported to Charleston for that purpose. In the coastal areas, black slaves soon outnumbered white colonists, as they did across the colony by 1708.
In 1734, most of the coastal portion of Saint Paul's Parish was separated to form the new Saint John's Colleton Parish. In 1769, the three parishes were absorbed into the Charleston Judicial District, the southwestern portion of which was referred to as Saint Bartholomew's.
In 1800, the new Colleton District was formed from the western half of the Charleston District. In 1816, it annexed a small portion of northwestern Charleston District.
In 1868, under the Reconstruction era new state constitution, South Carolina districts were reorganized as counties. Officials were to be elected by the resident voters rather than by state officials, as was done previously, thus giving more democratic power to local residents.
In 1897, the northeastern portion of the county was separated to form the new Dorchester County, with its seat at Saint George.
In 1911, the portion of the county east of the Edisto River was annexed by Charleston County. In 1919 and again in 1920, tiny portions of northwestern Colleton County were annexed to Bamberg County.
In March 1975, the town of Edisto Beach was annexed to Colleton County from Charleston County, thus bringing the county to its present size.
Geography
According to the U.S. Census Bureau, the county has a total area of 1,133 square miles (2,930 km2), of which 1,056 square miles (2,740 km2) is land and 77 square miles (200 km2) (6.8%) is water.[5] It is the fifth-largest county in South Carolina by land area and fourth-largest by total area.
Adjacent counties
- Orangeburg County - north
- Dorchester County - northeast
- Charleston County - east
- Beaufort County - south
- Hampton County - west
- Allendale County - west
- Bamberg County - northwest
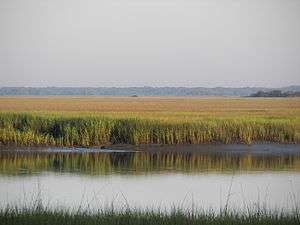
National protected area
State protected area
Demographics
| Historical population | |||
|---|---|---|---|
| Census | Pop. | %± | |
| 1800 | 24,903 | — | |
| 1810 | 26,359 | 5.8% | |
| 1820 | 26,404 | 0.2% | |
| 1830 | 27,256 | 3.2% | |
| 1840 | 25,548 | −6.3% | |
| 1850 | 39,505 | 54.6% | |
| 1860 | 41,916 | 6.1% | |
| 1870 | 25,410 | −39.4% | |
| 1880 | 38,386 | 51.1% | |
| 1890 | 40,293 | 5.0% | |
| 1900 | 33,452 | −17.0% | |
| 1910 | 35,390 | 5.8% | |
| 1920 | 29,897 | −15.5% | |
| 1930 | 25,821 | −13.6% | |
| 1940 | 26,268 | 1.7% | |
| 1950 | 28,242 | 7.5% | |
| 1960 | 27,816 | −1.5% | |
| 1970 | 27,622 | −0.7% | |
| 1980 | 31,776 | 15.0% | |
| 1990 | 34,377 | 8.2% | |
| 2000 | 38,264 | 11.3% | |
| 2010 | 38,892 | 1.6% | |
| Est. 2018 | 37,660 | [6] | −3.2% |
| U.S. Decennial Census[7] 1790-1960[8] 1900-1990[9] 1990-2000[10] 2010-2013[1] | |||
2000 census
As of the census[11] of 2000, there were 38,264 people, 14,470 households, and 10,490 families living in the county. The population density was 36 people per square mile (14/km²). There were 18,129 housing units at an average density of 17 per square mile (7/km²). The racial makeup of the county was 55.52% White, 42.18% Black or African American, 0.63% Native American, 0.25% Asian, 0.04% Pacific Islander, 0.56% from other races, and 0.82% from two or more races. 1.44% of the population were Hispanic or Latino of any race.
There were 14,470 households out of which 33.10% had children under the age of 18 living with them, 51.10% were married couples living together, 16.80% had a female householder with no husband present, and 27.50% were non-families. 24.00% of all households were made up of individuals and 10.10% had someone living alone who was 65 years of age or older. The average household size was 2.62 and the average family size was 3.11.
In the county, the population was spread out with 27.50% under the age of 18, 8.00% from 18 to 24, 26.90% from 25 to 44, 24.70% from 45 to 64, and 12.90% who were 65 years of age or older. The median age was 36 years. For every 100 females there were 91.90 males. For every 100 females age 18 and over, there were 87.90 males.
The median income for a household in the county was $29,733, and the median income for a family was $34,169. Males had a median income of $28,518 versus $19,228 for females. The per capita income for the county was $14,831. About 17.30% of families and 21.10% of the population were below the poverty line, including 28.70% of those under age 18 and 19.10% of those age 65 or over.
According to the 2000 Census, the Colleton County population is nearly 75% rural, with the exception of the Walterboro Urban Cluster (2000 pop.: 10,064). The total county population is also designated as the Walterboro Micropolitan Statistical Area.
2010 census
As of the 2010 United States Census, there were 38,892 people, 15,131 households, and 10,449 families living in the county.[12] The population density was 36.8 inhabitants per square mile (14.2/km2). There were 19,901 housing units at an average density of 18.8 per square mile (7.3/km2).[13] The racial makeup of the county was 57.0% white, 39.0% black or African American, 0.8% American Indian, 0.3% Asian, 1.3% from other races, and 1.5% from two or more races. Those of Hispanic or Latino origin made up 2.8% of the population.[12] In terms of ancestry, 25.0% were American, 7.3% were English, 6.5% were German, and 5.2% were Irish.[14]
Of the 15,131 households, 33.5% had children under the age of 18 living with them, 44.9% were married couples living together, 18.4% had a female householder with no husband present, 30.9% were non-families, and 26.8% of all households were made up of individuals. The average household size was 2.54 and the average family size was 3.07. The median age was 40.7 years.[12]
The median income for a household in the county was $33,263 and the median income for a family was $40,955. Males had a median income of $36,622 versus $25,898 for females. The per capita income for the county was $17,842. About 17.7% of families and 21.3% of the population were below the poverty line, including 28.3% of those under age 18 and 17.2% of those age 65 or over.[15]
Politics
| Year | Republican | Democratic | Third parties |
|---|---|---|---|
| 2016 | 52.7% 9,091 | 44.2% 7,627 | 3.1% 533 |
| 2012 | 49.4% 8,443 | 49.6% 8,475 | 1.0% 168 |
| 2008 | 49.2% 8,525 | 49.7% 8,616 | 1.0% 180 |
| 2004 | 51.5% 7,264 | 47.5% 6,699 | 1.0% 143 |
| 2000 | 50.5% 6,767 | 48.2% 6,449 | 1.3% 174 |
| 1996 | 42.9% 4,462 | 51.2% 5,329 | 5.9% 610 |
| 1992 | 40.2% 4,545 | 48.2% 5,455 | 11.6% 1,314 |
| 1988 | 52.0% 4,962 | 47.2% 4,508 | 0.8% 77 |
| 1984 | 55.6% 6,200 | 44.1% 4,910 | 0.3% 35 |
| 1980 | 44.8% 4,719 | 54.5% 5,745 | 0.8% 79 |
| 1976 | 39.0% 3,324 | 60.2% 5,134 | 0.8% 64 |
| 1972 | 69.5% 5,723 | 28.9% 2,376 | 1.6% 134 |
| 1968 | 34.7% 2,824 | 32.6% 2,651 | 32.8% 2,670 |
| 1964 | 69.3% 4,637 | 30.7% 2,051 | |
| 1960 | 56.2% 2,521 | 43.8% 1,962 | |
| 1956 | 15.7% 635 | 36.1% 1,463 | 48.2% 1,950 |
| 1952 | 59.2% 2,760 | 40.8% 1,905 | |
| 1948 | 1.5% 39 | 8.6% 223 | 89.9% 2,337 |
| 1944 | 2.3% 45 | 82.8% 1,653 | 15.0% 299 |
| 1940 | 5.2% 65 | 94.9% 1,197 | |
| 1936 | 0.5% 8 | 99.5% 1,463 | |
| 1932 | 0.3% 5 | 99.7% 1,908 | 0.1% 1 |
| 1928 | 1.9% 22 | 98.0% 1,122 | 0.1% 1 |
| 1924 | 1.4% 11 | 98.4% 800 | 0.3% 2 |
| 1920 | 1.5% 15 | 98.5% 990 | |
| 1916 | 3.1% 31 | 96.8% 974 | 0.1% 1 |
| 1912 | 1.7% 14 | 96.8% 797 | 1.5% 12 |
| 1904 | 8.4% 131 | 91.6% 1,421 | |
| 1900 | 12.0% 121 | 88.0% 889 |
Education
- Colleton County School District operates public schools, including Colleton County High School.
- Degrees can be earned at the University of South Carolina Salkehatchie in Walterboro.
References
- "State & County QuickFacts". United States Census Bureau. Retrieved November 22, 2013.
- "Find a County". National Association of Counties. Archived from the original on 2011-05-31. Retrieved 2011-06-07.
- Gannett, Henry (1905). The Origin of Certain Place Names in the United States. Govt. Print. Off. p. 87.
- "South Carolina: Individual County Chronologies". South Carolina Atlas of Historical County Boundaries. The Newberry Library. 2009. Retrieved March 20, 2015.
- "2010 Census Gazetteer Files". United States Census Bureau. August 22, 2012. Retrieved March 16, 2015.
- "Population and Housing Unit Estimates". Retrieved July 30, 2019.
- "U.S. Decennial Census". United States Census Bureau. Retrieved March 16, 2015.
- "Historical Census Browser". University of Virginia Library. Retrieved March 16, 2015.
- Forstall, Richard L., ed. (March 27, 1995). "Population of Counties by Decennial Census: 1900 to 1990". United States Census Bureau. Retrieved March 16, 2015.
- "Census 2000 PHC-T-4. Ranking Tables for Counties: 1990 and 2000" (PDF). United States Census Bureau. April 2, 2001. Retrieved March 16, 2015.
- "U.S. Census website". United States Census Bureau. Retrieved 2011-05-14.
- "DP-1 Profile of General Population and Housing Characteristics: 2010 Demographic Profile Data". United States Census Bureau. Archived from the original on 2020-02-13. Retrieved 2016-03-09.
- "Population, Housing Units, Area, and Density: 2010 - County". United States Census Bureau. Archived from the original on 2020-02-13. Retrieved 2016-03-09.
- "DP02 SELECTED SOCIAL CHARACTERISTICS IN THE UNITED STATES – 2006-2010 American Community Survey 5-Year Estimates". United States Census Bureau. Archived from the original on 2020-02-13. Retrieved 2016-03-09.
- "DP03 SELECTED ECONOMIC CHARACTERISTICS – 2006-2010 American Community Survey 5-Year Estimates". United States Census Bureau. Archived from the original on 2020-02-13. Retrieved 2016-03-09.
- Leip, David. "Dave Leip's Atlas of U.S. Presidential Elections". uselectionatlas.org. Retrieved 2018-03-13.
External links
| Wikimedia Commons has media related to Colleton County, South Carolina. |
- Colleton County website
- Colleton County History and Images
Places adjacent to Colleton County, South Carolina | ||||||||||
|---|---|---|---|---|---|---|---|---|---|---|
| ||||||||||
Municipalities and communities of Colleton County, South Carolina, United States | ||
|---|---|---|
| City | Map of South Carolina highlighting Colleton County | |
| Towns | ||
| CDPs | ||
| Unincorporated communities | ||
The Lowcountry of South Carolina | ||
|---|---|---|
| Counties |
|  |
| Major communities | ||
| Sea islands | ||
| History & culture | ||
| Military installations |
| |
| Natural areas | ||
| Other articles |
| |
| Authority control |
|
|---|