Jasper County, South Carolina
Jasper County is the southernmost county in the U.S. state of South Carolina. As of the 2010 census, the population was 24,777.[1] Its county seat is Ridgeland.[2] The county was formed in 1912 from portions of Hampton County and Beaufort County.
Jasper County | |
|---|---|
 | |
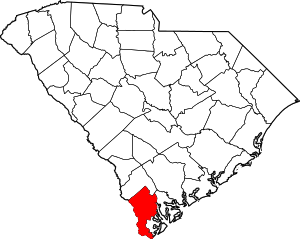 Location within the U.S. state of South Carolina | |
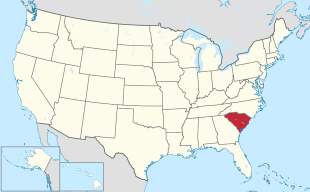 South Carolina's location within the U.S. | |
| Coordinates: 32°26′N 81°01′W | |
| Country | |
| State | |
| Founded | 1912 |
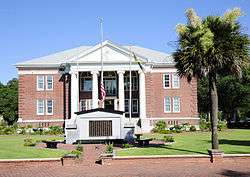
| Seat | Ridgeland |
| Largest city | Hardeeville |
| Area | |
| • Total | 699 sq mi (1,810 km2) |
| • Land | 655 sq mi (1,700 km2) |
| • Water | 44 sq mi (110 km2) 6.3%% |
| Population (2010) | |
| • Total | 24,777 |
| • Estimate (2018) | 28,971 |
| • Density | 35/sq mi (14/km2) |
| Time zone | UTC−5 (Eastern) |
| • Summer (DST) | UTC−4 (EDT) |
| Congressional district | 6th |
| Website | www |
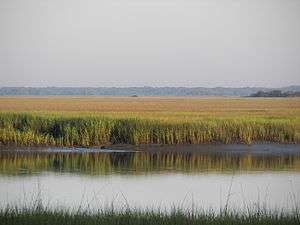
Jasper County is included in the Hilton Head Island-Bluffton-Beaufort, SC Metropolitan Statistical Area. It is located in the Lowcountry region of the state. For several decades, in contrast to neighboring Beaufort County, Jasper was one of the poorest counties in the state. Recent development from 2000 onwards has given the county new residents, expanded business opportunities, and a wealthier tax base. Since 2010, Jasper County is the second-fastest-growing county by population in South Carolina, behind Horry County.
Geography
According to the U.S. Census Bureau, the county has a total area of 699 square miles (1,810 km2), of which 655 square miles (1,700 km2) is land and 44 square miles (110 km2) (6.3%) is water.[3]
Adjacent counties
- Hampton County - north
- Beaufort County - east
- Chatham County, Georgia - south
- Effingham County, Georgia - west
National protected areas
Demographics
| Historical population | |||
|---|---|---|---|
| Census | Pop. | %± | |
| 1920 | 9,868 | — | |
| 1930 | 9,988 | 1.2% | |
| 1940 | 11,011 | 10.2% | |
| 1950 | 10,995 | −0.1% | |
| 1960 | 12,237 | 11.3% | |
| 1970 | 11,885 | −2.9% | |
| 1980 | 14,504 | 22.0% | |
| 1990 | 15,487 | 6.8% | |
| 2000 | 20,678 | 33.5% | |
| 2010 | 24,777 | 19.8% | |
| Est. 2018 | 28,971 | [4] | 16.9% |
| U.S. Decennial Census[5] 1790-1960[6] 1900-1990[7] 1990-2000[8] 2010-2013[1] | |||
2000 census
As of the census[9] of 2000, there were 20,678 people, 7,042 households, and 5,091 families living in the county. The population density was 32 people per square mile (12/km²). There were 7,928 housing units at an average density of 12 per square mile (5/km²). The racial makeup of the county was 52.69% Black or African American, 42.39% White, 0.37% Native American, 0.44% Asian, 0.05% Pacific Islander, 3.39% from other races, and 0.67% from two or more races. 5.75% of the population were Hispanic or Latino of any race.
There were 7,042 households out of which 34.5% had children under the age of 18 living with them, 48.1% were married couples living together, 18.2% had a female householder with no husband present, and 27.7% were non-families. 23.2% of all households were made up of individuals and 8.8% had someone living alone who was 65 years of age or older. The average household size was 2.75 and the average family size was 3.22.
In the county, the population was spread out with 26.8% under the age of 18, 10.3% from 18 to 24, 30.7% from 25 to 44, 21.2% from 45 to 64, and 11.0% who were 65 years of age or older. The median age was 34 years. For every 100 females, there were 111.0 males. For every 100 females age 18 and over, there were 111.3 males.
The median income for a household in the county was $30,727, and the median income for a family was $36,793. Males had a median income of $29,407 versus $21,055 for females. The per capita income for the county was $14,161. About 15.4% of families and 20.7% of the population were below the poverty line, including 26.3% of those under age 18 and 21.4% of those age 65 or over.
2010 census
As of the 2010 United States Census, there were 24,777 people, 8,517 households, and 5,944 families living in the county.[10] The population density was 37.8 inhabitants per square mile (14.6/km2). There were 10,299 housing units at an average density of 15.7 per square mile (6.1/km2).[11] The racial makeup of the county was 46.0% black or African American, 43.0% white, 0.7% Asian, 0.5% American Indian, 0.1% Pacific islander, 8.3% from other races, and 1.4% from two or more races. Those of Hispanic or Latino origin made up 15.1% of the population.[10] In terms of ancestry, 7.1% were Irish, and 2.5% were American.[12]
Of the 8,517 households, 36.9% had children under the age of 18 living with them, 44.2% were married couples living together, 18.6% had a female householder with no husband present, 30.2% were non-families, and 24.8% of all households were made up of individuals. The average household size was 2.73 and the average family size was 3.23. The median age was 34.6 years.[10]
The median income for a household in the county was $37,393 and the median income for a family was $45,800. Males had a median income of $31,999 versus $24,859 for females. The per capita income for the county was $17,997. About 14.2% of families and 21.5% of the population were below the poverty line, including 32.2% of those under age 18 and 14.5% of those age 65 or over.[13]
Government
Jasper County is governed by a five-member partisan county council, who are elected in staggered four year terms. The council appoints a county administrator who is tasked with running the day-to-day operations of the county, with the exception of the Sheriff's Office.
Mary Gordon Ellis, the first woman elected to the South Carolina legislature, represented Jasper County in the state senate for one term, from 1928 to 1932, after having previously served as state superintendent of schools.[14]
Politics
| Year | Republican | Democratic | Third parties |
|---|---|---|---|
| 2016 | 45.4% 5,187 | 52.1% 5,956 | 2.5% 284 |
| 2012 | 41.6% 4,169 | 57.5% 5,757 | 1.0% 95 |
| 2008 | 38.0% 3,365 | 60.9% 5,389 | 1.1% 100 |
| 2004 | 42.8% 2,933 | 56.1% 3,840 | 1.1% 73 |
| 2000 | 37.3% 2,414 | 56.4% 3,646 | 6.3% 409 |
| 1996 | 31.3% 2,024 | 62.7% 4,053 | 6.0% 391 |
| 1992 | 29.9% 1,725 | 59.9% 3,453 | 10.2% 585 |
| 1988 | 40.7% 2,004 | 58.7% 2,894 | 0.6% 31 |
| 1984 | 45.1% 3,102 | 54.6% 3,753 | 0.4% 24 |
| 1980 | 32.5% 1,617 | 66.7% 3,312 | 0.8% 40 |
| 1976 | 29.5% 1,221 | 70.1% 2,903 | 0.4% 16 |
| 1972 | 57.2% 1,650 | 41.7% 1,203 | 1.1% 31 |
| 1968 | 20.3% 633 | 45.0% 1,402 | 34.7% 1,081 |
| 1964 | 61.4% 1,593 | 38.6% 1,002 | |
| 1960 | 51.9% 779 | 48.1% 721 | |
| 1956 | 31.7% 403 | 16.5% 210 | 51.8% 658 |
| 1952 | 55.7% 800 | 44.3% 636 | |
| 1948 | 3.5% 31 | 15.9% 141 | 80.6% 715 |
| 1944 | 4.0% 18 | 50.7% 230 | 45.4% 206 |
| 1940 | 8.9% 41 | 91.1% 418 | |
| 1936 | 0.9% 4 | 99.1% 452 | |
| 1932 | 2.7% 11 | 97.3% 399 | |
| 1928 | 4.7% 5 | 95.3% 102 | |
| 1924 | 0.0% 0 | 69.5% 89 | 30.5% 39 |
| 1920 | 0.0% 0 | 100.0% 219 | |
| 1916 | 0.0% 0 | 100.0% 243 | |
| 1912 | 0.0% 0 | 100.0% 198 |
See also
References
- "State & County QuickFacts". United States Census Bureau. Archived from the original on June 6, 2011. Retrieved October 1, 2014.
- "Find a County". National Association of Counties. Archived from the original on 2011-05-31. Retrieved 2011-06-07.
- "2010 Census Gazetteer Files". United States Census Bureau. August 22, 2012. Retrieved March 18, 2015.
- "Population and Housing Unit Estimates". Retrieved July 30, 2019.
- "U.S. Decennial Census". United States Census Bureau. Retrieved March 18, 2015.
- "Historical Census Browser". University of Virginia Library. Retrieved March 18, 2015.
- Forstall, Richard L., ed. (March 27, 1995). "Population of Counties by Decennial Census: 1900 to 1990". United States Census Bureau. Retrieved March 18, 2015.
- "Census 2000 PHC-T-4. Ranking Tables for Counties: 1990 and 2000" (PDF). United States Census Bureau. April 2, 2001. Retrieved March 18, 2015.
- "U.S. Census website". United States Census Bureau. Retrieved 2011-05-14.
- "DP-1 Profile of General Population and Housing Characteristics: 2010 Demographic Profile Data". United States Census Bureau. Archived from the original on 2020-02-13. Retrieved 2016-03-11.
- "Population, Housing Units, Area, and Density: 2010 - County". United States Census Bureau. Archived from the original on 2020-02-13. Retrieved 2016-03-11.
- "DP02 SELECTED SOCIAL CHARACTERISTICS IN THE UNITED STATES – 2006-2010 American Community Survey 5-Year Estimates". United States Census Bureau. Archived from the original on 2020-02-13. Retrieved 2016-03-11.
- "DP03 SELECTED ECONOMIC CHARACTERISTICS – 2006-2010 American Community Survey 5-Year Estimates". United States Census Bureau. Archived from the original on 2020-02-13. Retrieved 2016-03-11.
- "Women Wielding Power-South Carolina". nwhm.org. Archived from the original on 6 September 2015. Retrieved 10 September 2015.
- Leip, David. "Dave Leip's Atlas of U.S. Presidential Elections". uselectionatlas.org. Retrieved 2018-03-13.
External links

- Jasper County History and Images
Places adjacent to Jasper County, South Carolina | ||||||||||
|---|---|---|---|---|---|---|---|---|---|---|
| ||||||||||
Municipalities and communities of Jasper County, South Carolina, United States | ||
|---|---|---|
| City | Map of South Carolina highlighting Jasper County | |
| Town | ||
| Unincorporated communities | ||
| Footnotes | ‡This populated place also has portions in an adjacent county or counties | |
The Lowcountry of South Carolina | ||
|---|---|---|
| Counties |
|  |
| Major communities | ||
| Sea islands | ||
| History & culture | ||
| Military installations |
| |
| Natural areas | ||
| Other articles |
| |
| Authority control |
|
|---|