Williamsburg County, South Carolina
Williamsburg County is a county located in the U.S. state of South Carolina. As of the 2010 census its population was 34,423.[1] The county seat is Kingstree.[2] After a previous incarnation of Williamsburg County, the current county was created in 1804.[3]
Williamsburg County | |
|---|---|
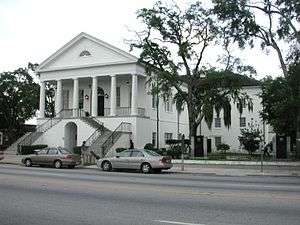 Williamsburg County Courthouse | |
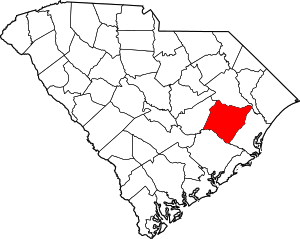 Location within the U.S. state of South Carolina | |
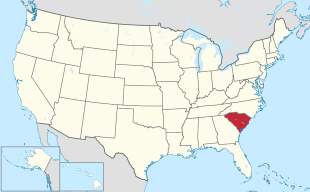 South Carolina's location within the U.S. | |
| Coordinates: 33°37′N 79°44′W | |
| Country | |
| State | |
| Founded | 1804 |
| Named for | William of Orange |
| Seat | Kingstree |
| Largest city | Kingstree |
| Area | |
| • Total | 937 sq mi (2,430 km2) |
| • Land | 934 sq mi (2,420 km2) |
| • Water | 2.9 sq mi (8 km2) 0.3%% |
| Population (2010) | |
| • Total | 34,423 |
| • Estimate (2018) | 30,606 |
| • Density | 37/sq mi (14/km2) |
| Time zone | UTC−5 (Eastern) |
| • Summer (DST) | UTC−4 (EDT) |
| Congressional district | 6th |
| Website | www |
History
Geography
According to the U.S. Census Bureau, the county has a total area of 937 square miles (2,430 km2), of which 934 square miles (2,420 km2) are land and 2.9 square miles (7.5 km2) (0.3%) are covered by water.[4]
Adjacent counties
- Florence County - north
- Marion County - northeast
- Georgetown County - east
- Berkeley County - south
- Clarendon County - west
Demographics
| Historical population | |||
|---|---|---|---|
| Census | Pop. | %± | |
| 1810 | 6,871 | — | |
| 1820 | 8,716 | 26.9% | |
| 1830 | 9,018 | 3.5% | |
| 1840 | 10,327 | 14.5% | |
| 1850 | 12,447 | 20.5% | |
| 1860 | 15,489 | 24.4% | |
| 1870 | 15,489 | 0.0% | |
| 1880 | 24,110 | 55.7% | |
| 1890 | 27,777 | 15.2% | |
| 1900 | 31,685 | 14.1% | |
| 1910 | 37,626 | 18.8% | |
| 1920 | 38,539 | 2.4% | |
| 1930 | 34,914 | −9.4% | |
| 1940 | 41,011 | 17.5% | |
| 1950 | 43,807 | 6.8% | |
| 1960 | 40,932 | −6.6% | |
| 1970 | 34,243 | −16.3% | |
| 1980 | 38,226 | 11.6% | |
| 1990 | 36,815 | −3.7% | |
| 2000 | 37,217 | 1.1% | |
| 2010 | 34,423 | −7.5% | |
| Est. 2018 | 30,606 | [5] | −11.1% |
| U.S. Decennial Census[6] 1790-1960[7] 1900-1990[8] 1990-2000[9] 2010-2013[1] | |||
2000 census
As of the census[10] of 2000, there were 37,217 people, 13,714 households, and 10,052 families living in the county. The population density was 40 people per square mile (15/km²). There were 15,552 housing units at an average density of 17 per square mile (6/km²). The racial makeup of the county was 66.26% Black or African American, 32.74% White, 0.16% Native American, 0.20% Asian, 0.16% from other races, and 0.48% from two or more races. 0.73% of the population were Hispanic or Latino of any race.
There were 13,714 households out of which 34.50% had children under the age of 18 living with them, 46.30% were married couples living together, 22.40% had a female householder with no husband present, and 26.70% were non-families. 24.90% of all households were made up of individuals and 10.40% had someone living alone who was 65 years of age or older. The average household size was 2.69 and the average family size was 3.22.
In the county, the population was spread out with 28.60% under the age of 18, 9.00% from 18 to 24, 25.70% from 25 to 44, 23.60% from 45 to 64, and 13.00% who were 65 years of age or older. The median age was 36 years. For every 100 females there were 87.90 males. For every 100 females age 18 and over, there were 81.50 males.
The median income for a household in the county was $24,214, and the median income for a family was $30,379. Males had a median income of $26,680 versus $18,202 for females. The per capita income for the county was $12,794. About 23.70% of families and 27.90% of the population were below the poverty line, including 36.10% of those under age 18 and 25.90% of those age 65 or over.
2010 census
As of the 2010 United States Census, there were 34,423 people, 13,007 households, and 8,854 families living in the county.[11] The population density was 36.8 inhabitants per square mile (14.2/km2). There were 15,359 housing units at an average density of 16.4 per square mile (6.3/km2).[12] The racial makeup of the county was 65.8% black or African American, 31.8% white, 0.4% Asian, 0.3% American Indian, 1.0% from other races, and 0.8% from two or more races. Those of Hispanic or Latino origin made up 2.0% of the population.[11] In terms of ancestry, and 4.6% were American.[13]
Of the 13,007 households, 33.2% had children under the age of 18 living with them, 40.0% were married couples living together, 23.0% had a female householder with no husband present, 31.9% were non-families, and 29.0% of all households were made up of individuals. The average household size was 2.53 and the average family size was 3.13. The median age was 40.2 years.[11]
The median income for a household in the county was $24,191 and the median income for a family was $33,705. Males had a median income of $37,678 versus $22,303 for females. The per capita income for the county was $13,513. About 26.5% of families and 32.9% of the population were below the poverty line, including 45.6% of those under age 18 and 27.5% of those age 65 or over.[14]
Communities
City
- Kingstree (county seat)
Towns
- Andrews (mostly in Georgetown County)
- Greeleyville
- Hemingway
- Lane
- Stuckey
Unincorporated communities
- Cades
- Gourdin
- Hebron
- Indiantown
- Nesmith
- Outland
- Rhems
- Salters
- Trio
- Piney Forest
Politics
Prior to 1948, Williamsburg County was a Democratic Party stronghold similar to the rest of the Solid South, with Democratic presidential candidates receiving near-unanimous margins of victory in most years. The twenty years from 1948 to 1968 were a highly transitional time for the politics of South Carolina & Williamsburg County, largely in part due to the Democratic Party's increasing support for African-American civil rights & enfranchisement. Dixiecrats managed to carry the county twice, while Republicans managed to carry the county three times in this timespan, while increased black registration led to Democrat Hubert Humphrey winning the county in 1968. Since 1968, the majority African-American county has only backed a Republican once in 1972, when Richard Nixon won the county as he swept every county statewide in the midst of a 49-state national landslide.
| Year | Republican | Democratic | Third parties |
|---|---|---|---|
| 2016 | 32.3% 4,864 | 66.1% 9,953 | 1.6% 237 |
| 2012 | 29.6% 4,824 | 69.5% 11,335 | 0.9% 145 |
| 2008 | 30.4% 5,004 | 68.6% 11,279 | 1.0% 160 |
| 2004 | 34.5% 4,795 | 65.0% 9,044 | 0.6% 79 |
| 2000 | 39.9% 4,524 | 59.3% 6,723 | 0.8% 84 |
| 1996 | 34.8% 3,957 | 61.5% 6,987 | 3.6% 413 |
| 1992 | 37.1% 5,289 | 56.6% 8,077 | 6.4% 911 |
| 1988 | 44.4% 5,914 | 55.1% 7,343 | 0.5% 67 |
| 1984 | 46.0% 6,492 | 53.7% 7,586 | 0.4% 50 |
| 1980 | 38.3% 5,110 | 61.0% 8,135 | 0.7% 99 |
| 1976 | 37.5% 5,275 | 62.2% 8,745 | 0.3% 35 |
| 1972 | 52.0% 5,729 | 47.3% 5,213 | 0.7% 73 |
| 1968 | 28.1% 3,029 | 47.3% 5,106 | 24.6% 2,652 |
| 1964 | 68.2% 4,810 | 31.9% 2,248 | |
| 1960 | 60.6% 2,324 | 39.4% 1,513 | |
| 1956 | 8.8% 330 | 18.2% 683 | 73.0% 2,739 |
| 1952 | 66.1% 2,576 | 33.9% 1,320 | |
| 1948 | 1.2% 23 | 6.3% 126 | 92.5% 1,840 |
| 1944 | 2.1% 27 | 86.6% 1,118 | 11.3% 146 |
| 1940 | 3.0% 34 | 97.0% 1,089 | |
| 1936 | 0.5% 6 | 99.5% 1,284 | |
| 1932 | 0.7% 9 | 99.3% 1,244 | |
| 1928 | 2.6% 22 | 97.4% 825 | |
| 1924 | 0.6% 4 | 99.4% 672 | |
| 1920 | 1.3% 12 | 98.7% 895 | |
| 1916 | 4.5% 57 | 95.5% 1,213 | |
| 1912 | 0.8% 6 | 96.8% 729 | 2.4% 18 |
| 1904 | 11.2% 187 | 88.8% 1,476 | |
| 1900 | 20.5% 323 | 79.5% 1,256 |
References
- "State & County QuickFacts". United States Census Bureau. Retrieved November 25, 2013.
- "Find a County". National Association of Counties. Retrieved 2011-06-07.
- "South Carolina: Individual County Chronologies". South Carolina Atlas of Historical County Boundaries. The Newberry Library. 2009. Retrieved March 21, 2015.
- "2010 Census Gazetteer Files". United States Census Bureau. August 22, 2012. Retrieved March 19, 2015.
- "Population and Housing Unit Estimates". Retrieved July 30, 2019.
- "U.S. Decennial Census". United States Census Bureau. Retrieved March 19, 2015.
- "Historical Census Browser". University of Virginia Library. Retrieved March 19, 2015.
- Forstall, Richard L., ed. (March 27, 1995). "Population of Counties by Decennial Census: 1900 to 1990". United States Census Bureau. Retrieved March 19, 2015.
- "Census 2000 PHC-T-4. Ranking Tables for Counties: 1990 and 2000" (PDF). United States Census Bureau. April 2, 2001. Retrieved March 19, 2015.
- "U.S. Census website". United States Census Bureau. Retrieved 2011-05-14.
- "DP-1 Profile of General Population and Housing Characteristics: 2010 Demographic Profile Data". United States Census Bureau. Archived from the original on 2020-02-13. Retrieved 2016-03-11.
- "Population, Housing Units, Area, and Density: 2010 - County". United States Census Bureau. Archived from the original on 2020-02-13. Retrieved 2016-03-11.
- "DP02 SELECTED SOCIAL CHARACTERISTICS IN THE UNITED STATES – 2006-2010 American Community Survey 5-Year Estimates". United States Census Bureau. Archived from the original on 2020-02-13. Retrieved 2016-03-11.
- "DP03 SELECTED ECONOMIC CHARACTERISTICS – 2006-2010 American Community Survey 5-Year Estimates". United States Census Bureau. Archived from the original on 2020-02-13. Retrieved 2016-03-11.
- Leip, David. "Dave Leip's Atlas of U.S. Presidential Elections". uselectionatlas.org. Retrieved 2018-03-14.
External links

Places adjacent to Williamsburg County, South Carolina | ||||||||||
|---|---|---|---|---|---|---|---|---|---|---|
| ||||||||||
Municipalities and communities of Williamsburg County, South Carolina, United States | ||
|---|---|---|
| Towns | Map of South Carolina highlighting Williamsburg County | |
| Unincorporated communities | ||
| Footnotes | ‡This populated place also has portions in an adjacent county or counties | |
| Authority control |
|
|---|