Berkeley County, South Carolina
Berkeley County is a county in the U.S. state of South Carolina. As of the 2010 census, its population was 177,843.[1] Its county seat is Moncks Corner.[2] After two previous incarnations of Berkeley County, the current county was created in 1882.[3]
Berkeley County | |
|---|---|
 | |
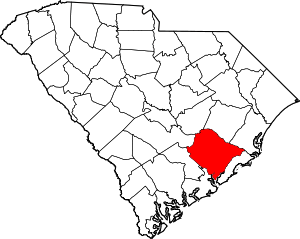 Location within the U.S. state of South Carolina | |
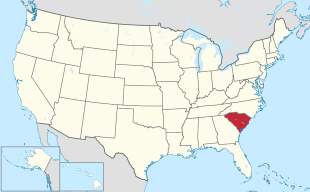 South Carolina's location within the U.S. | |
| Coordinates: 33°12′N 79°57′W | |
| Country | |
| State | |
| Founded | 1882 |
| Seat | Moncks Corner |
| Largest city | Goose Creek |
| Area | |
| • Total | 1,229 sq mi (3,180 km2) |
| • Land | 1,099 sq mi (2,850 km2) |
| • Water | 130 sq mi (300 km2) 11% |
| Population (2010) | |
| • Total | 177,843 |
| • Estimate (2019) | 227,907 |
| • Density | 140/sq mi (56/km2) |
| Time zone | UTC−5 (Eastern) |
| • Summer (DST) | UTC−4 (EDT) |
| Congressional districts | 1st, 6th |
| Website | www |
Berkeley County is included in the Charleston-North Charleston, SC Metropolitan Statistical Area.
History
Berkeley County was established in 1682. It was named after John and William Berkeley, co-owners of the Province of Carolina.[4] It became part of the Charleston District in 1769. It did not exist as a District during most of the 19th century and generally was part of the Low Country culture. In 1882, after Democrats regained control of the state legislature following the Reconstruction era, they established the current incarnation of Berkeley County, with its seat at Mount Pleasant. The county seat was moved in 1895 to Moncks Corner.[3]
The Old Berkeley County Courthouse was listed on the National Register of Historic Places in 1971.[5]
Geography
According to the U.S. Census Bureau, the county has a total area of 1,229 square miles (3,180 km2), of which 1,099 square miles (2,850 km2) is land and 130 square miles (340 km2) (11%) is water.[6]
Adjacent counties
- Georgetown County - east
- Williamsburg County - northeast
- Clarendon County - north
- Orangeburg County - northwest
- Dorchester County - west
- Charleston County - south
National protected areas
Demographics
| Historical population | |||
|---|---|---|---|
| Census | Pop. | %± | |
| 1890 | 55,428 | — | |
| 1900 | 30,454 | −45.1% | |
| 1910 | 23,487 | −22.9% | |
| 1920 | 22,558 | −4.0% | |
| 1930 | 22,236 | −1.4% | |
| 1940 | 27,128 | 22.0% | |
| 1950 | 30,251 | 11.5% | |
| 1960 | 38,196 | 26.3% | |
| 1970 | 56,199 | 47.1% | |
| 1980 | 94,727 | 68.6% | |
| 1990 | 128,776 | 35.9% | |
| 2000 | 142,651 | 10.8% | |
| 2010 | 177,843 | 24.7% | |
| Est. 2019 | 227,907 | [7] | 28.2% |
| U.S. Decennial Census[8] 1790-1960[9] 1900-1990[10] 1990-2000[11] 2010-2019[1] | |||
2000 census
At the 2000 census there were 142,651 people, 49,922 households, and 37,691 families living in the county. The population density was 130 people per square mile (50/km²). There were 54,717 housing units at an average density of 50 per square mile (19/km²). The racial makeup of the county was 68.00% White, 26.63% Black or African American, 0.52% Native American, 1.87% Asian, 0.08% Pacific Islander, 1.20% from other races, and 1.70% from two or more races. 2.76% of the population were Hispanic or Latino of any race. 16.4% were of American, 10.0% German, 8.4% Irish and 7.7% English ancestry according to Census 2000.[12] Of the 49,922 households 39.20% had children under the age of 18 living with them, 56.70% were married couples living together, 14.20% had a female householder with no husband present, and 24.50% were non-families. 19.40% of households were one person and 5.60% were one person aged 65 or older. The average household size was 2.75 and the average family size was 3.15.
The age distribution was 28.00% under the age of 18, 11.70% from 18 to 24, 31.20% from 25 to 44, 21.20% from 45 to 64, and 7.90% 65 or older. The median age was 32 years. For every 100 females, there were 103.20 males. For every 100 females age 18 and over, there were 102.20 males.
The median household income was $39,908 and the median family income was $44,242. Males had a median income of $31,583 versus $22,420 for females. The per capita income for the county was $16,879. About 9.70% of families and 11.80% of the population were below the poverty line, including 15.60% of those under age 18 and 12.90% of those age 65 or over.
2010 census
At the 2010 census, there were 177,843 people, 65,419 households, and 47,141 families living in the county.[13] The population density was 161.8 inhabitants per square mile (62.5/km2). There were 73,372 housing units at an average density of 66.8 per square mile (25.8/km2).[14] The racial makeup of the county was 66.5% white, 25.0% black or African American, 2.3% Asian, 0.6% American Indian, 0.1% Pacific islander, 2.8% from other races, and 2.7% from two or more races. Those of Hispanic or Latino origin made up 6.0% of the population.[13] In terms of ancestry,[15]
Of the 65,419 households, 38.0% had children under the age of 18 living with them, 51.3% were married couples living together, 15.3% had a female householder with no husband present, 27.9% were non-families, and 22.0% of households were made up of individuals. The average household size was 2.66 and the average family size was 3.10. The median age was 34.5 years.[13]
The median household income was $50,777 and the median family income was $56,869. Males had a median income of $40,534 versus $30,997 for females. The per capita income for the county was $22,865. About 9.9% of families and 12.6% of the population were below the poverty line, including 18.2% of those under age 18 and 10.3% of those age 65 or over.[16]
Politics
Current County Administrator: Johnny Cribb County Council:[17]
- District 1: Vacant (due to death of sitting council member)
- District 2: Josh Whitley
- District 3: Phillip Obie, II
- District 4: Tommy Newell
- District 5: Brandon Cox
- District 6: Jack Schurlknight
- District 7: Caldwell Pinckney, Jr.
- District 8: Steve Davis
- Berkeley County Sheriff: S. Duane Lewis[18]
- Berkeley County Coroner: George Oliver
| Year | Republican | Democratic | Third parties |
|---|---|---|---|
| 2016 | 56.1% 44,587 | 38.6% 30,705 | 5.3% 4,225 |
| 2012 | 56.4% 38,475 | 41.9% 28,542 | 1.7% 1,178 |
| 2008 | 55.9% 36,205 | 42.8% 27,755 | 1.3% 821 |
| 2004 | 60.7% 32,104 | 38.1% 20,142 | 1.3% 691 |
| 2000 | 57.2% 24,796 | 40.9% 17,707 | 1.9% 813 |
| 1996 | 53.2% 17,691 | 40.2% 13,358 | 6.6% 2,193 |
| 1992 | 50.9% 18,048 | 35.3% 12,533 | 13.8% 4,898 |
| 1988 | 63.8% 16,779 | 35.4% 9,312 | 0.8% 206 |
| 1984 | 69.2% 16,972 | 30.1% 7,380 | 0.7% 159 |
| 1980 | 55.6% 12,830 | 42.7% 9,850 | 1.7% 384 |
| 1976 | 41.6% 6,981 | 58.1% 9,741 | 0.4% 59 |
| 1972 | 66.7% 9,345 | 32.1% 4,497 | 1.3% 177 |
| 1968 | 28.9% 4,021 | 36.6% 5,089 | 34.6% 4,808 |
| 1964 | 63.3% 6,100 | 36.7% 3,537 | |
| 1960 | 48.8% 2,422 | 51.2% 2,542 | |
| 1956 | 28.2% 1,055 | 24.1% 902 | 47.6% 1,779 |
| 1952 | 59.2% 2,482 | 40.8% 1,708 | |
| 1948 | 3.0% 58 | 16.8% 323 | 80.2% 1,538 |
| 1944 | 4.5% 32 | 72.8% 521 | 22.8% 163 |
| 1940 | 15.7% 91 | 84.3% 490 | |
| 1936 | 1.2% 8 | 98.9% 690 | |
| 1932 | 2.3% 22 | 97.7% 941 | |
| 1928 | 13.2% 42 | 86.8% 276 | |
| 1924 | 4.9% 26 | 95.1% 501 | |
| 1920 | 4.2% 24 | 95.8% 548 | |
| 1916 | 1.3% 6 | 98.7% 457 | |
| 1912 | 1.5% 5 | 94.7% 323 | 3.8% 13 |
| 1904 | 14.7% 115 | 85.3% 665 | |
| 1900 | 19.2% 112 | 80.8% 472 |
Attractions
- Cypress Gardens, SC
- Mepkin Abbey
- Berkeley County Museum and Heritage Center
Communities
Cities
- Charleston (mostly in Charleston County)
- Goose Creek
- Hanahan
- North Charleston (partly in Dorchester County and Charleston County)
Towns
- Bonneau
- Jamestown
- Moncks Corner (county seat)
- St. Stephen
- Summerville (partly in Dorchester County and Charleston County)
Census-designated places
- Bonneau Beach
- Ladson (partly in Charleston County, partly in Dorchester County)
- Pinopolis
- Russellville
- Sangaree
See also
References
- "State & County QuickFacts". United States Census Bureau. Retrieved November 22, 2013.
- "Find a County". National Association of Counties. Archived from the original on 2011-05-31. Retrieved 2011-06-07.
- "South Carolina: Individual County Chronologies". South Carolina Atlas of Historical County Boundaries. The Newberry Library. 2009. Retrieved March 20, 2015.
- Federal Writers' Project (1941). Palmetto Place Names. Sloane Printing Co. p. 12.
- "National Register Information System". National Register of Historic Places. National Park Service. July 9, 2010.
- "2010 Census Gazetteer Files". United States Census Bureau. August 22, 2012. Retrieved March 16, 2015.
- "Population and Housing Unit Estimates". Retrieved May 21, 2020.
- "U.S. Decennial Census". United States Census Bureau. Retrieved March 16, 2015.
- "Historical Census Browser". University of Virginia Library. Retrieved March 16, 2015.
- Forstall, Richard L., ed. (March 27, 1995). "Population of Counties by Decennial Census: 1900 to 1990". United States Census Bureau. Retrieved March 16, 2015.
- "Census 2000 PHC-T-4. Ranking Tables for Counties: 1990 and 2000" (PDF). United States Census Bureau. April 2, 2001. Retrieved March 16, 2015.
- "U.S. Census website". United States Census Bureau. Retrieved 2011-05-14.
- "DP-1 Profile of General Population and Housing Characteristics: 2010 Demographic Profile Data". United States Census Bureau. Archived from the original on 2020-02-13. Retrieved 2016-03-09.
- "Population, Housing Units, Area, and Density: 2010 - County". United States Census Bureau. Archived from the original on 2020-02-13. Retrieved 2016-03-09.
- "DP02 SELECTED SOCIAL CHARACTERISTICS IN THE UNITED STATES – 2006-2010 American Community Survey 5-Year Estimates". United States Census Bureau. Archived from the original on 2020-02-13. Retrieved 2016-03-09.
- "DP03 SELECTED ECONOMIC CHARACTERISTICS – 2006-2010 American Community Survey 5-Year Estimates". United States Census Bureau. Archived from the original on 2020-02-13. Retrieved 2016-03-09.
- "County Officials | Berkeley County Government". www.berkeleycountysc.gov. Retrieved 2018-08-13.
- "Sheriff's Office | Berkeley County Government". www.berkeleycountysc.gov. Retrieved 2018-08-13.
- Leip, David. "Dave Leip's Atlas of U.S. Presidential Elections". uselectionatlas.org. Retrieved 2018-03-13.
External links
- Official website
- Berkeley County history and images
Places adjacent to Berkeley County, South Carolina | |
|---|---|
Municipalities and communities of Berkeley County, South Carolina, United States | ||
|---|---|---|
| Cities | Map of South Carolina highlighting Berkeley County | |
| Towns | ||
| CDPs | ||
| Other unincorporated communities | ||
| Footnotes | ‡This populated place also has portions in an adjacent county or counties | |
| Authority control |
|
|---|