Darlington County, South Carolina
Darlington County is a county in the U.S. state of South Carolina. As of the 2010 census, its population was 67,234. Its county seat is Darlington.[1] Hartsville is the largest city in the county. Darlington County is home to the Darlington Raceway, which hosts the annual NASCAR Southern 500. Darlington County is also home to Coker College in Hartsville. Darlington County was named by an act in March 1785.
Darlington County | |
|---|---|
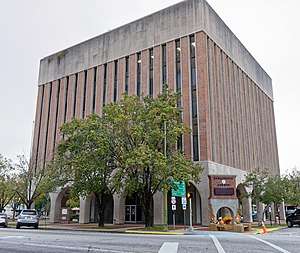 Darlington County Courthouse | |
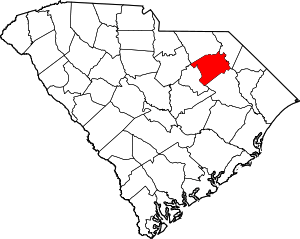 Location within the U.S. state of South Carolina | |
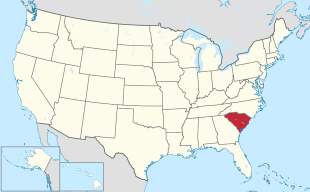 South Carolina's location within the U.S. | |
| Coordinates: 34°20′N 79°58′W | |
| Country | |
| State | |
| Founded | 1785 |
| Seat | Darlington |
| Largest city | Hartsville |
| Area | |
| • Total | 567 sq mi (1,470 km2) |
| • Land | 561 sq mi (1,450 km2) |
| • Water | 5.7 sq mi (15 km2) 1.0% |
| Population (2010) | |
| • Total | 67,234 |
| • Estimate (2018) | 66,802 |
| • Density | 120/sq mi (46/km2) |
| Time zone | UTC−5 (Eastern) |
| • Summer (DST) | UTC−4 (EDT) |
| Congressional district | 7th |
| Website | www |
Darlington County is included in the Florence, SC Metropolitan Statistical Area. The county's population was nearly 60% rural in 2000.
Geography
According to the U.S. Census Bureau, the county has a total area of 567 square miles (1,470 km2), of which 561 square miles (1,450 km2) is land and 5.7 square miles (15 km2) (1.0%) is water.[2]
Adjacent counties
- Florence County - southeast
- Marlboro County - northeast
- Chesterfield County - northwest
- Lee County - southwest
- Kershaw County - west
Demographics
| Historical population | |||
|---|---|---|---|
| Census | Pop. | %± | |
| 1800 | 7,631 | — | |
| 1810 | 9,047 | 18.6% | |
| 1820 | 10,949 | 21.0% | |
| 1830 | 13,728 | 25.4% | |
| 1840 | 14,822 | 8.0% | |
| 1850 | 16,830 | 13.5% | |
| 1860 | 20,361 | 21.0% | |
| 1870 | 26,243 | 28.9% | |
| 1880 | 34,485 | 31.4% | |
| 1890 | 29,134 | −15.5% | |
| 1900 | 32,388 | 11.2% | |
| 1910 | 36,027 | 11.2% | |
| 1920 | 39,126 | 8.6% | |
| 1930 | 41,427 | 5.9% | |
| 1940 | 45,198 | 9.1% | |
| 1950 | 50,016 | 10.7% | |
| 1960 | 52,928 | 5.8% | |
| 1970 | 53,442 | 1.0% | |
| 1980 | 62,717 | 17.4% | |
| 1990 | 61,851 | −1.4% | |
| 2000 | 67,394 | 9.0% | |
| 2010 | 68,681 | 1.9% | |
| Est. 2018 | 66,802 | [3] | −2.7% |
| U.S. Decennial Census[4] 1790-1960[5] 1900-1990[6] 1990-2000[7] 2010-2013[8] | |||
2000 census
As of the census[9] of 2000, there were 67,394 people, 25,793 households, and 18,441 families living in the county. The population density was 120 inhabitants per square mile (46/km2). There were 28,942 housing units at an average density of 52 per square mile (20/km2). The racial makeup of the county was 56.98% White, 41.70% Black or African American, 0.19% Native American, 0.21% Asian, 0.01% Pacific Islander, 0.39% from other races, and 0.52% from two or more races. 0.98% of the population were Hispanic or Latino of any race.
There were 25,793 households out of which 32.20% had children under the age of 18 living with them, 48.30% were married couples living together, 18.70% had a female householder with no husband present, and 28.50% were non-families. 25.10% of all households were made up of individuals and 9.20% had someone living alone who was 65 years of age or older. The average household size was 2.57 and the average family size was 3.07.
In the county, the population was spread out with 26.30% under the age of 18, 9.00% from 18 to 24, 28.20% from 25 to 44, 24.40% from 45 to 64, and 12.10% who were 65 years of age or older. The median age was 36 years. For every 100 females, there were 89.80 males. For every 100 females age 18 and over, there were 84.60 males.
The median income for a household in the county was $31,087, and the median income for a family was $37,662. Males had a median income of $30,947 versus $20,998 for females. The per capita income for the county was $16,283. About 16.40% of families and 20.30% of the population were below the poverty line, including 26.70% of those under age 18 and 22.10% of those age 65 or over.
As of Census 2000, Darlington County was classified as 41% urban and 59% rural. It contains the two urbanized areas of Hartsville (2000 pop. 14,907) and Darlington (12,066). The county's population is included within the Florence Metropolitan Statistical Area.
2010 census
As of the 2010 United States Census, there were 68,681 people, 26,531 households, and 18,552 families living in the county.[10] The population density was 122.4 inhabitants per square mile (47.3/km2). There were 30,297 housing units at an average density of 54.0 per square mile (20.8/km2).[11] The racial makeup of the county was 55.9% white, 41.6% black or African American, 0.3% Asian, 0.3% American Indian, 0.9% from other races, and 1.1% from two or more races. Those of Hispanic or Latino origin made up 1.7% of the population.[10] In terms of ancestry, 9.5% were American, 7.0% were English, and 5.3% were Irish.[12]
Of the 26,531 households, 34.1% had children under the age of 18 living with them, 44.0% were married couples living together, 20.5% had a female householder with no husband present, 30.1% were non-families, and 26.0% of all households were made up of individuals. The average household size was 2.54 and the average family size was 3.04. The median age was 39.6 years.[10]
The median income for a household in the county was $38,379 and the median income for a family was $46,894. Males had a median income of $40,089 versus $29,255 for females. The per capita income for the county was $20,096. About 14.6% of families and 20.0% of the population were below the poverty line, including 30.7% of those under age 18 and 15.1% of those age 65 or over.[13]
Communities
Cities
- Darlington (county seat)
- Hartsville
Towns
Census-designated places
Other unincorporated communities
Notable people
- O.D Odell (Carolina King of Comedy) Comedian as seen on Bounce T.V's "Off the Chain" was born in Darlington.
- Orlando Hudson, former Major League baseball player, was born in Darlington.
- Albert Haynesworth, a professional football player who played primarily for the Tennessee Titans and Washington Redskins, was born in Hartsville.
- W. W. Hicks, member of the Louisiana House of Representatives for Webster Parish, 1900 to 1904, born in Darlington County in 1843
- John Sidney Killen, pioneer farmer, cattleman, and member of the Louisiana House of Representatives for Webster Parish in 1871; born in Darlington County in 1826
- Bobo Newsom, MLB pitcher with the Tigers, Senators, Cubs, Dodgers, Yankees, Giants, and Red Sox. He compiled a 211-222 record over 20 seasons, including a 21-5 season in 1940. SC 151 in Hartsville is named Bobo Newsom Highway in his honor.
- Jordan Lyles, Major League baseball player, was born in Hartsville.
- William G. Farrow, lieutenant in the United States Army Air Corps who participated in the Doolittle Raid. Farrow was born in Darlington, SC in 1918.[14]
- Harry G. Byrd, an American Major League Baseball right-handed starting pitcher who played for the Philadelphia Athletics, New York Yankees, Baltimore Orioles, Chicago White Sox, and Detroit Tigers. He was born in Darlington, South Carolina. SC 151 in Darlington is named Harry Byrd Highway in his honor.
- James E. Williams, a sailor of the United States Navy during the 1950s and 1960s. He was the most highly decorated enlisted man in the history of the United States Navy and a recipient of the Congressional Medal of Honor.
Politics
| Year | Republican | Democratic | Third parties |
|---|---|---|---|
| 2016 | 50.5% 14,989 | 46.8% 13,888 | 2.7% 797 |
| 2012 | 47.9% 14,434 | 51.3% 15,457 | 0.9% 259 |
| 2008 | 49.6% 14,544 | 49.5% 14,505 | 1.0% 285 |
| 2004 | 52.7% 13,416 | 46.5% 11,829 | 0.8% 209 |
| 2000 | 51.6% 11,290 | 46.9% 10,253 | 1.5% 320 |
| 1996 | 45.2% 8,220 | 49.2% 8,943 | 5.7% 1,031 |
| 1992 | 44.0% 8,912 | 44.9% 9,090 | 11.1% 2,251 |
| 1988 | 55.2% 9,854 | 42.7% 7,625 | 2.0% 364 |
| 1984 | 58.7% 11,100 | 39.4% 7,456 | 1.9% 354 |
| 1980 | 48.4% 8,289 | 49.6% 8,489 | 2.1% 353 |
| 1976 | 39.5% 6,678 | 60.2% 10,165 | 0.3% 54 |
| 1972 | 72.0% 11,756 | 27.1% 4,414 | 0.9% 149 |
| 1968 | 35.4% 4,947 | 27.2% 3,803 | 37.4% 5,231 |
| 1964 | 57.3% 6,717 | 42.7% 5,010 | |
| 1960 | 42.8% 3,494 | 57.2% 4,668 | |
| 1956 | 22.5% 1,597 | 40.9% 2,908 | 36.6% 2,603 |
| 1952 | 37.7% 3,463 | 62.3% 5,718 | |
| 1948 | 3.8% 104 | 26.3% 726 | 69.9% 1,930 |
| 1944 | 2.3% 46 | 91.4% 1,808 | 6.3% 124 |
| 1940 | 4.1% 60 | 95.9% 1,395 | |
| 1936 | 0.6% 12 | 99.4% 1,995 | |
| 1932 | 2.2% 31 | 97.8% 1,409 | 0.1% 1 |
| 1928 | 4.1% 48 | 95.9% 1,135 | |
| 1924 | 0.3% 3 | 99.0% 956 | 0.7% 7 |
| 1920 | 1.4% 18 | 98.6% 1,262 | |
| 1916 | 0.3% 5 | 99.5% 1,462 | 0.2% 3 |
| 1912 | 0.0% 0 | 99.8% 883 | 0.2% 2 |
| 1904 | 2.8% 42 | 97.2% 1,464 | |
| 1900 | 6.3% 83 | 93.7% 1,230 |
References
- "Find a County". National Association of Counties. Archived from the original on 2011-05-31. Retrieved 2011-06-07.
- "2010 Census Gazetteer Files". United States Census Bureau. August 22, 2012. Retrieved March 17, 2015.
- "Population and Housing Unit Estimates". Retrieved July 30, 2019.
- "U.S. Decennial Census". United States Census Bureau. Retrieved March 17, 2015.
- "Historical Census Browser". University of Virginia Library. Retrieved March 17, 2015.
- Forstall, Richard L., ed. (March 27, 1995). "Population of Counties by Decennial Census: 1900 to 1990". United States Census Bureau. Retrieved March 17, 2015.
- "Census 2000 PHC-T-4. Ranking Tables for Counties: 1990 and 2000" (PDF). United States Census Bureau. April 2, 2001. Retrieved March 17, 2015.
- "State & County QuickFacts". United States Census Bureau. Archived from the original on June 6, 2011. Retrieved November 23, 2013.
- "U.S. Census website". United States Census Bureau. Retrieved 2011-05-14.
- "DP-1 Profile of General Population and Housing Characteristics: 2010 Demographic Profile Data". United States Census Bureau. Archived from the original on 2020-02-13. Retrieved 2016-03-09.
- "Population, Housing Units, Area, and Density: 2010 - County". United States Census Bureau. Archived from the original on 2020-02-13. Retrieved 2016-03-09.
- "DP02 SELECTED SOCIAL CHARACTERISTICS IN THE UNITED STATES – 2006-2010 American Community Survey 5-Year Estimates". United States Census Bureau. Archived from the original on 2020-02-13. Retrieved 2016-03-09.
- "DP03 SELECTED ECONOMIC CHARACTERISTICS – 2006-2010 American Community Survey 5-Year Estimates". United States Census Bureau. Archived from the original on 2020-02-13. Retrieved 2016-03-09.
- "Veteran Tributes". veterantributes.org. Retrieved 2017-04-11.
- Leip, David. "Dave Leip's Atlas of U.S. Presidential Elections". uselectionatlas.org. Retrieved 2018-03-13.
External links
- Darlington County's Website
- Darlington County School District
- Darlington County History and Images
- 1905 Reprint of Bishop Gregg's History of the Old Cheraws with additional material as an appendix. (Google Book pdf)
Places adjacent to Darlington County, South Carolina | ||||||||||
|---|---|---|---|---|---|---|---|---|---|---|
| ||||||||||
Municipalities and communities of Darlington County, South Carolina, United States | ||
|---|---|---|
| Cities | Map of South Carolina highlighting Darlington County | |
| Towns | ||
| CDP | ||
| Other unincorporated communities | ||
| Ghost towns | ||
| Footnotes | ‡This populated place also has portions in an adjacent county or counties | |
| Authority control |
|
|---|