1972 United States presidential election in Pennsylvania
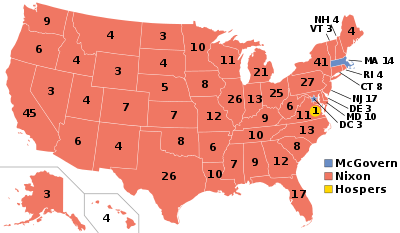
The 1972 United States presidential election in Pennsylvania took place on November 7, 1972, and was part of the 1972 United States presidential election. Voters chose 27 representatives, or electors to the Electoral College, who voted for president and vice president.
| ||||||||||||||||||||||||||
| ||||||||||||||||||||||||||
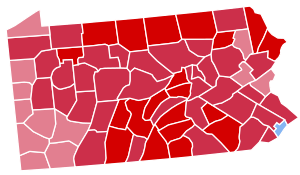 County results
| ||||||||||||||||||||||||||
| ||||||||||||||||||||||||||
.jpg)
.jpg)
| Elections in Pennsylvania | ||||||||||||||
|---|---|---|---|---|---|---|---|---|---|---|---|---|---|---|
 | ||||||||||||||
|
||||||||||||||
|
||||||||||||||
|
||||||||||||||
|
||||||||||||||
Pennsylvania strongly voted for the Republican nominee, President Richard Nixon, over the Democratic nominee, Senator George McGovern. Nixon won Pennsylvania by a large margin of 19.98%, winning every county except for Philadelphia. This result nonetheless was over 3% more Democratic than the nation at-large. As of the 2016 presidential election, this is the last election in which Allegheny County voted Republican,[1] and the last time that that county did not vote the same as Philadelphia.
Results
| 1972 United States presidential election in Pennsylvania[2] | |||||
|---|---|---|---|---|---|
| Party | Candidate | Votes | Percentage | Electoral votes | |
| Republican | Richard Nixon | 2,714,521 | 59.11% | 27 | |
| Democratic | George McGovern | 1,796,951 | 39.13% | 0 | |
| Constitution | John Schmitz | 70,593 | 1.54% | 0 | |
| Socialist Workers | Linda Jenness | 4,639 | 0.10% | 0 | |
| Write-ins | Write-ins | 2,715 | 0.06% | 0 | |
| Communist | Gus Hall | 2,686 | 0.06% | 0 | |
| Totals | 4,592,106 | 100.0% | 27 | ||
| Voter Turnout (Voting age/Registered) | 56%/78% | ||||
Results by county
| County | Richard Milhous Nixon Republican |
George Stanley McGovern Democratic |
Various candidates Other parties |
Margin | Total votes cast | ||||
|---|---|---|---|---|---|---|---|---|---|
| # | % | # | % | # | % | # | % | ||
| Adams | 13,593 | 70.19% | 5,529 | 28.55% | 243 | 1.25% | 8,064 | 41.64% | 19,365 |
| Allegheny | 371,737 | 55.60% | 282,496 | 42.26% | 14,302 | 2.14% | 89,241 | 13.35% | 668,535 |
| Armstrong | 17,557 | 61.61% | 10,490 | 36.81% | 451 | 1.58% | 7,067 | 24.80% | 28,498 |
| Beaver | 43,637 | 56.42% | 31,570 | 40.82% | 2,130 | 2.75% | 12,067 | 15.60% | 77,337 |
| Bedford | 11,243 | 73.30% | 3,836 | 25.01% | 259 | 1.69% | 7,407 | 48.29% | 15,338 |
| Berks | 66,172 | 62.35% | 36,563 | 34.45% | 3,392 | 3.20% | 29,609 | 27.90% | 106,127 |
| Blair | 33,126 | 75.10% | 10,023 | 22.72% | 961 | 2.18% | 23,103 | 52.38% | 44,110 |
| Bradford | 15,050 | 73.57% | 5,204 | 25.44% | 204 | 1.00% | 9,846 | 48.13% | 20,458 |
| Bucks | 99,684 | 62.28% | 56,784 | 35.48% | 3,591 | 2.24% | 42,900 | 26.80% | 160,059 |
| Butler | 29,665 | 65.09% | 14,695 | 32.24% | 1,214 | 2.66% | 14,970 | 32.85% | 45,574 |
| Cambria | 43,825 | 60.05% | 27,950 | 38.30% | 1,200 | 1.64% | 15,875 | 21.75% | 72,975 |
| Cameron | 1,935 | 68.45% | 828 | 29.29% | 64 | 2.26% | 1,107 | 39.16% | 2,827 |
| Carbon | 11,639 | 59.05% | 7,774 | 39.44% | 299 | 1.52% | 3,865 | 19.61% | 19,712 |
| Centre | 20,683 | 60.48% | 13,194 | 38.58% | 320 | 0.94% | 7,489 | 21.90% | 34,197 |
| Chester | 72,726 | 68.44% | 31,118 | 29.29% | 2,415 | 2.27% | 41,608 | 39.16% | 106,259 |
| Clarion | 10,073 | 67.96% | 4,509 | 30.42% | 239 | 1.61% | 5,564 | 37.54% | 14,821 |
| Clearfield | 16,780 | 63.54% | 9,246 | 35.01% | 383 | 1.45% | 7,534 | 28.53% | 26,409 |
| Clinton | 8,205 | 62.54% | 4,772 | 36.37% | 142 | 1.08% | 3,433 | 26.17% | 13,119 |
| Columbia | 14,187 | 63.59% | 7,222 | 32.37% | 900 | 4.03% | 6,965 | 31.22% | 22,309 |
| Crawford | 18,393 | 64.38% | 9,371 | 32.80% | 805 | 2.82% | 9,022 | 31.58% | 28,569 |
| Cumberland | 42,099 | 72.87% | 14,562 | 25.20% | 1,114 | 1.93% | 27,537 | 47.66% | 57,775 |
| Dauphin | 54,307 | 69.38% | 22,587 | 28.86% | 1,376 | 1.76% | 31,720 | 40.53% | 78,270 |
| Delaware | 175,414 | 63.91% | 94,144 | 34.30% | 4,893 | 1.78% | 81,270 | 29.61% | 274,451 |
| Elk | 7,900 | 61.20% | 4,710 | 36.49% | 298 | 2.31% | 3,190 | 24.71% | 12,908 |
| Erie | 61,542 | 58.22% | 42,022 | 39.75% | 2,149 | 2.03% | 19,520 | 18.47% | 105,713 |
| Fayette | 27,288 | 54.06% | 22,475 | 44.52% | 716 | 1.42% | 4,813 | 9.53% | 50,479 |
| Forest | 1,374 | 71.75% | 509 | 26.58% | 32 | 1.67% | 865 | 45.17% | 1,915 |
| Franklin | 24,093 | 70.01% | 9,456 | 27.48% | 866 | 2.52% | 14,637 | 42.53% | 34,415 |
| Fulton | 2,515 | 66.24% | 1,192 | 31.39% | 90 | 2.37% | 1,323 | 34.84% | 3,797 |
| Greene | 7,790 | 57.52% | 5,562 | 41.07% | 191 | 1.41% | 2,228 | 16.45% | 13,543 |
| Huntingdon | 9,606 | 72.68% | 3,394 | 25.68% | 216 | 1.63% | 6,212 | 47.00% | 13,216 |
| Indiana | 18,122 | 61.90% | 10,833 | 37.01% | 319 | 1.09% | 7,289 | 24.90% | 29,274 |
| Jefferson | 11,631 | 68.92% | 5,024 | 29.77% | 221 | 1.31% | 6,607 | 39.15% | 16,876 |
| Juniata | 4,412 | 66.32% | 2,156 | 32.41% | 85 | 1.28% | 2,256 | 33.91% | 6,653 |
| Lackawanna | 58,838 | 56.11% | 45,465 | 43.35% | 566 | 0.54% | 13,373 | 12.75% | 104,869 |
| Lancaster | 81,036 | 75.64% | 24,223 | 22.61% | 1,879 | 1.75% | 56,813 | 53.03% | 107,138 |
| Lawrence | 23,712 | 56.06% | 17,595 | 41.60% | 990 | 2.34% | 6,117 | 14.46% | 42,297 |
| Lebanon | 25,008 | 77.38% | 6,683 | 20.68% | 629 | 1.95% | 18,325 | 56.70% | 32,320 |
| Lehigh | 58,023 | 62.39% | 33,325 | 35.83% | 1,654 | 1.78% | 24,698 | 26.56% | 93,002 |
| Luzerne | 81,358 | 60.89% | 51,128 | 38.27% | 1,120 | 0.84% | 30,230 | 22.63% | 133,606 |
| Lycoming | 28,913 | 68.70% | 11,999 | 28.51% | 1,175 | 2.79% | 16,914 | 40.19% | 42,087 |
| McKean | 11,958 | 71.72% | 4,513 | 27.07% | 202 | 1.21% | 7,445 | 44.65% | 16,673 |
| Mercer | 27,961 | 59.37% | 18,087 | 38.40% | 1,052 | 2.23% | 9,874 | 20.96% | 47,100 |
| Mifflin | 9,989 | 72.10% | 3,667 | 26.47% | 199 | 1.44% | 6,322 | 45.63% | 13,855 |
| Monroe | 12,701 | 67.51% | 5,619 | 29.87% | 494 | 2.63% | 7,082 | 37.64% | 18,814 |
| Montgomery | 173,662 | 64.31% | 91,959 | 34.06% | 4,397 | 1.63% | 81,703 | 30.26% | 270,018 |
| Montour | 4,386 | 69.64% | 1,755 | 27.87% | 157 | 2.49% | 2,631 | 41.78% | 6,298 |
| Northampton | 41,822 | 56.30% | 32,335 | 43.53% | 124 | 0.17% | 9,487 | 12.77% | 74,281 |
| Northumberland | 25,912 | 64.16% | 13,885 | 34.38% | 588 | 1.46% | 12,027 | 29.78% | 40,385 |
| Perry | 8,082 | 73.31% | 2,731 | 24.77% | 212 | 1.92% | 5,351 | 48.54% | 11,025 |
| Philadelphia | 344,096 | 43.89% | 431,736 | 55.07% | 8,138 | 1.04% | -87,640 | -11.18% | 783,970 |
| Pike | 4,568 | 74.79% | 1,385 | 22.68% | 155 | 2.54% | 3,183 | 52.11% | 6,108 |
| Potter | 4,422 | 70.91% | 1,710 | 27.42% | 104 | 1.67% | 2,712 | 43.49% | 6,236 |
| Schuylkill | 44,071 | 61.56% | 26,077 | 36.42% | 1,447 | 2.02% | 17,994 | 25.13% | 71,595 |
| Snyder | 7,308 | 78.20% | 1,834 | 19.63% | 203 | 2.17% | 5,474 | 58.58% | 9,345 |
| Somerset | 19,739 | 68.44% | 8,743 | 30.31% | 359 | 1.24% | 10,996 | 38.13% | 28,841 |
| Sullivan | 1,886 | 67.17% | 885 | 31.52% | 37 | 1.32% | 1,001 | 35.65% | 2,808 |
| Susquehanna | 9,476 | 67.79% | 4,154 | 29.72% | 349 | 2.50% | 5,322 | 38.07% | 13,979 |
| Tioga | 10,028 | 72.05% | 3,733 | 26.82% | 157 | 1.13% | 6,295 | 45.23% | 13,918 |
| Union | 6,905 | 73.57% | 2,278 | 24.27% | 202 | 2.15% | 4,627 | 49.30% | 9,385 |
| Venango | 13,991 | 67.28% | 6,302 | 30.31% | 501 | 2.41% | 7,689 | 36.98% | 20,794 |
| Warren | 10,018 | 66.05% | 4,877 | 32.16% | 272 | 1.79% | 5,141 | 33.90% | 15,167 |
| Washington | 42,587 | 54.00% | 34,781 | 44.10% | 1,494 | 1.89% | 7,806 | 9.90% | 78,862 |
| Wayne | 8,948 | 74.51% | 2,733 | 22.76% | 328 | 2.73% | 6,215 | 51.75% | 12,009 |
| Westmoreland | 75,085 | 54.60% | 59,322 | 43.13% | 3,120 | 2.27% | 15,763 | 11.46% | 137,527 |
| Wyoming | 6,423 | 74.42% | 2,112 | 24.47% | 96 | 1.11% | 4,311 | 49.95% | 8,631 |
| York | 63,606 | 68.19% | 27,520 | 29.50% | 2,154 | 2.31% | 36,086 | 38.69% | 93,280 |
| Totals | 2,714,521 | 59.11% | 1,796,951 | 39.13% | 80,634 | 1.76% | 917,570 | 19.98% | 4,592,106 |
References
- Sullivan, Robert David; ‘How the Red and Blue Map Evolved Over the Past Century’; America Magazine in The National Catholic Review; June 29, 2016
- David Leip. "1972 Presidential General Election Results – Pennsylvania". Dave Leip’s U.S. Election Atlas. Retrieved 2018-03-24.