Whitman County, Washington
| Whitman County, Washington | |
|---|---|
 | |
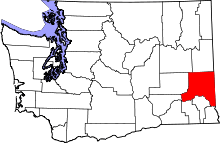 Location in the U.S. state of Washington | |
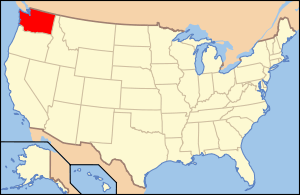 Washington's location in the U.S. | |
| Founded | 29 November, 1871 |
| Named for | Marcus Whitman |
| Seat | Colfax |
| Largest city | Pullman |
| Area | |
| • Total | 2,178 sq mi (5,641 km2) |
| • Land | 2,159 sq mi (5,592 km2) |
| • Water | 19 sq mi (49 km2), 0.9% |
| Population (est.) | |
| • (2017) | 49,046 |
| • Density | 22/sq mi (8/km2) |
| Congressional district | 5th |
| Time zone | Pacific: UTC−8/−7 |
| Website |
www |
Whitman County is a county located in the U.S. state of Washington. As of the 2010 census, the population was 44,776.[1] The county seat is Colfax,[2] and its largest city is Pullman.
The county was formed from Stevens County in 1871.[3] It is named after Marcus Whitman, a Presbyterian missionary who, with his wife Narcissa, was killed in 1847 by members of the Cayuse tribe.[4]
Whitman County comprises the Pullman, Washington Metropolitan Statistical Area.
History
The area delineated by the future Washington state boundary began to be colonized at the start of the nineteenth century, both by Americans and Canadians. However, the majority of Canadian exploration and interest in the land was due to the fur trade, whereas American settlers were principally seeking land for agriculture and cattle raising. The Treaty of 1818 provided for dual control of this area by US and Canadian government officials. During this period, the future Washington Territory was divided into two administrative zones: Clark County and Lewis County (made official in 1845).
The dual-control concept was unwieldy and led to continual argument, and occasional conflict. The status of the Washington area was settled in 1846, when the Oregon Treaty ceded the land south of North latitude 49 degrees to American control.
In 1854, Skamania County was split from the original Clark County. Also in 1854, Walla Walla County was split from the new Skamania County. In 1863, Stevens County was split from Walla Walla County, and in 1871, a portion of Stevens County was set off to form Whitman County. The 1871 shape of Whitman County was considerably larger than its present boundary, as Adams, Franklin, and Lincoln counties were sectioned off from Whitman County in 1883. After, that, Whitman County retained its shape, including through the period after Washington became the 42nd state of the Union in 1889.
Geography
According to the U.S. Census Bureau, the county has a total area of 2,178 square miles (5,640 km2), of which 2,159 square miles (5,590 km2) is land and 19 square miles (49 km2) (0.9%) is water.[5] Whitman County is part of the Palouse, a wide and rolling prairie-like region of the middle Columbia basin.
Rivers
- Snake River
- Palouse River
- Union Flat Creek
- Rock Creek
- Pine Creek
Lakes and reservoirs
- Lake Herbert G. West, formed from Lower Monumental Dam
- Lake Bryan, named for Dr. Enoch A. Bryan, behind the Little Goose Dam
- Lower Granite Lake, behind the Lower Granite Dam
- Rock Lake
Summits and peaks
- Tekoa Mountain (elevation: 4009')
- Kamiak Butte (elevation: 3641')
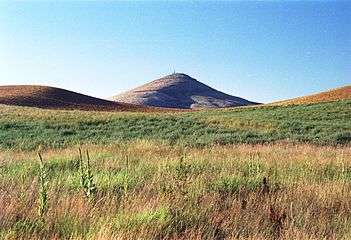
- Steptoe Butte (elevation: 3612')
- Bald Butte (elevation: 3369)
Notable parks
- Steptoe Butte State Park
- Kamiak Butte County Park
- Palouse Falls State Park
- Central Ferry State Park
- Boyer Park and Marina
- Wawawai County Park
Adjacent counties
- Spokane County - north
- Benewah County, Idaho - northeast
- Latah County, Idaho - east
- Nez Perce County, Idaho - southeast
- Asotin County - south/southeast
- Garfield County - south
- Columbia County - south
- Franklin County - southwest
- Adams County - west
- Lincoln County - northwest
Major highways
Airports
- Pullman–Moscow Regional Airport: Airport with GA operations and a few airline flights with Alaska Airlines
- Port of Whitman Business Air Center Airport: Small GA Airport in Colfax
Demographics
| Historical population | |||
|---|---|---|---|
| Census | Pop. | %± | |
| 1880 | 7,014 | — | |
| 1890 | 19,109 | 172.4% | |
| 1900 | 25,360 | 32.7% | |
| 1910 | 33,280 | 31.2% | |
| 1920 | 31,323 | −5.9% | |
| 1930 | 28,014 | −10.6% | |
| 1940 | 27,221 | −2.8% | |
| 1950 | 32,469 | 19.3% | |
| 1960 | 31,263 | −3.7% | |
| 1970 | 37,900 | 21.2% | |
| 1980 | 40,103 | 5.8% | |
| 1990 | 38,775 | −3.3% | |
| 2000 | 40,740 | 5.1% | |
| 2010 | 44,776 | 9.9% | |
| Est. 2017 | 49,046 | [6] | 9.5% |
| U.S. Decennial Census[7] 1790–1960[8] 1900–1990[9] 1990–2000[10] 2010–2016[1] | |||
2000 census
As of the census[11] of 2000, there were 40,740 people, 15,257 households, and 8,055 families residing in the county. The population density was 19 people per square mile (7/km²). There were 16,676 housing units at an average density of 8 per square mile (3/km²). The racial makeup of the county was 88.07% White, 1.53% Black or African American, 0.73% Native American, 5.55% Asian, 0.27% Pacific Islander, 1.22% from other races, and 2.63% from two or more races. 2.99% of the population were Hispanic or Latino of any race. 21.9% were of German, 9.8% English, 8.6% Irish, 8.3% United States or American and 6.6% Norwegian ancestry.
There were 15,257 households out of which 24.60% had children under the age of 18 living with them, 44.20% were married couples living together, 6.20% had a female householder with no husband present, and 47.20% were non-families. 29.40% of all households were made up of individuals and 7.10% had someone living alone who was 65 years of age or older. The average household size was 2.31 and the average family size was 2.91.
In the county, the population was spread out with 18.10% under the age of 18, 32.60% from 18 to 24, 24.00% from 25 to 44, 16.00% from 45 to 64, and 9.20% who were 65 years of age or older. The median age was 25 years. For every 100 females there were 102.50 males. For every 100 females age 18 and over, there were 101.90 males.
The median income for a household in the county was $28,584, and the median income for a family was $44,830. Males had a median income of $33,381 versus $27,046 for females. The per capita income for the county was $15,298. About 11.00% of families and 25.60% of the population were below the poverty line, including 16.50% of those under age 18 and 5.50% of those age 65 or over.
2010 census
As of the 2010 United States Census, there were 44,776 people, 17,468 households, and 8,130 families residing in the county.[12] The population density was 20.7 inhabitants per square mile (8.0/km2). There were 19,323 housing units at an average density of 8.9 per square mile (3.4/km2).[13] The racial makeup of the county was 84.6% white, 7.8% Asian, 1.7% black or African American, 0.7% American Indian, 0.2% Pacific islander, 1.4% from other races, and 3.6% from two or more races. Those of Hispanic or Latino origin made up 4.6% of the population.[12] In terms of ancestry, 29.4% were German, 14.5% were English, 13.4% were Irish, 7.1% were Norwegian, and 4.1% were American.[14]
Of the 17,468 households, 20.8% had children under the age of 18 living with them, 38.4% were married couples living together, 5.4% had a female householder with no husband present, 53.5% were non-families, and 32.7% of all households were made up of individuals. The average household size was 2.22 and the average family size was 2.86. The median age was 24.4 years.[12]
The median income for a household in the county was $36,368 and the median income for a family was $61,598. Males had a median income of $46,663 versus $34,496 for females. The per capita income for the county was $19,506. About 10.7% of families and 27.6% of the population were below the poverty line, including 13.3% of those under age 18 and 5.7% of those age 65 or over.[15]
Politics
The county is traditionally Republican. It is part of Washington's 5th congressional district and is represented by Republican Cathy McMorris Rodgers. Quite conservative, rural Whitman was one of only three counties in the state to be won by Barry Goldwater in 1964. Since that election, the county has been won by the winning candidate in all but three presidential elections, 1976, 2012, and 2016. Richard Nixon, Ronald Reagan, Bill Clinton, and George W. Bush each won the county twice.
In 2008, Barack Obama received 51.57% of the Whitman County vote.[16] In 2012, he received 46.9% of the vote, with Mitt Romney winning with a 49.7% plurality.[17] Whitman was the only county in eastern Washington to approve same-sex marriage via Referendum 74. It was the only county to vote in favor of Referendum 74 while voting for the Republican candidate for president. Whitman County voters also approved marijuana legalization via Initiative 502.
| Year | Republican | Democratic | Third parties |
|---|---|---|---|
| 2016 | 41.1% 7,403 | 45.2% 8,146 | 13.8% 2,479 |
| 2012 | 49.3% 8,507 | 46.5% 8,037 | 4.2% 726 |
| 2008 | 46.1% 8,104 | 51.6% 9,070 | 2.4% 415 |
| 2004 | 52.2% 9,397 | 46.0% 8,287 | 1.8% 328 |
| 2000 | 55.5% 9,003 | 40.1% 6,509 | 4.5% 725 |
| 1996 | 42.4% 6,734 | 45.7% 7,262 | 11.9% 1,899 |
| 1992 | 36.8% 6,428 | 43.7% 7,637 | 19.5% 3,413 |
| 1988 | 50.1% 7,680 | 48.3% 7,403 | 1.6% 250 |
| 1984 | 59.5% 10,021 | 39.3% 6,621 | 1.2% 207 |
| 1980 | 50.7% 8,636 | 33.6% 5,726 | 15.6% 2,662 |
| 1976 | 54.2% 8,168 | 41.1% 6,197 | 4.7% 703 |
| 1972 | 58.7% 9,548 | 38.4% 6,248 | 2.9% 470 |
| 1968 | 56.6% 7,810 | 37.8% 5,218 | 5.5% 761 |
| 1964 | 50.0% 6,765 | 49.9% 6,760 | 0.1% 13 |
| 1960 | 59.6% 8,069 | 40.3% 5,458 | 0.1% 17 |
| 1956 | 63.8% 8,572 | 36.1% 4,854 | 0.1% 8 |
| 1952 | 65.7% 8,905 | 34.0% 4,611 | 0.3% 44 |
| 1948 | 50.3% 6,411 | 47.2% 6,015 | 2.5% 314 |
| 1944 | 52.2% 6,000 | 47.4% 5,449 | 0.4% 41 |
| 1940 | 49.7% 6,356 | 49.6% 6,351 | 0.7% 92 |
| 1936 | 33.0% 3,955 | 64.8% 7,753 | 2.2% 265 |
| 1932 | 42.9% 4,727 | 54.0% 5,945 | 3.1% 339 |
| 1928 | 69.9% 7,065 | 29.4% 2,969 | 0.7% 67 |
| 1924 | 52.1% 4,960 | 18.3% 1,745 | 29.5% 2,811 |
| 1920 | 64.7% 6,344 | 28.6% 2,806 | 6.7% 659 |
| 1916 | 43.8% 4,933 | 52.3% 5,888 | 3.8% 430 |
| 1912 | 20.0% 1,989 | 36.4% 3,621 | 43.6% 4,333[19] |
| 1908 | 52.6% 3,376 | 37.2% 2,386 | 10.2% 656 |
| 1904 | 66.5% 4,090 | 24.7% 1,519 | 8.8% 543 |
| 1900 | 42.5% 2,366 | 50.8% 2,826 | 6.7% 373 |
| 1896 | 29.7% 1,592 | 68.8% 3,690 | 1.6% 85 |
| 1892 | 37.3% 2,131 | 36.1% 2,061 | 26.6% 1,517 |
Economy
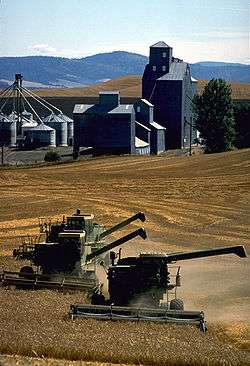
Whitman County has highly productive agriculture. According to Heart of Washington, Whitman County produces more barley, wheat, dry peas, and lentils than any other county in the United States.[20]
The county is also home to Schweitzer Engineering Laboratories in Pullman.
Education
Pullman is home to Washington State University, the state's land-grant university.
Communities
Cities
Towns
Census-designated place
Unincorporated communities
Ghost town
Images
Communities
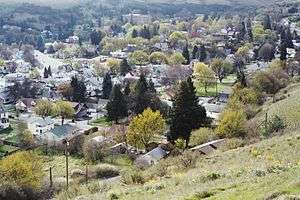
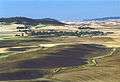

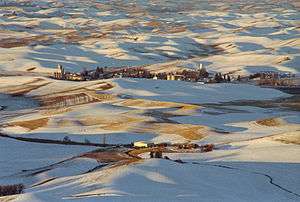
Geography
 A farm in Whitman County
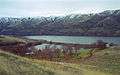
 Lower Granite Dam and Boyer Park and Marina on the Snake River
See also
References
- 1 2 "State & County QuickFacts". United States Census Bureau. Retrieved 8 January 2014.
- ↑ "Find a County". National Association of Counties. Retrieved 7 June 2011.
- ↑ "Milestones for Washington State History — Part 2: 1851 to 1900". HistoryLink.org. 6 March 2003.
- ↑ Meany, Edmond S. (1923). Origin of Washington geographic names. Seattle: University of Washington Press. p. 348.
- ↑ "2010 Census Gazetteer Files". United States Census Bureau. 22 August 2012. Retrieved 16 July 2015.
- ↑ "Population and Housing Unit Estimates". Retrieved 4 April 2018.
- ↑ "U.S. Decennial Census". United States Census Bureau. Retrieved 8 January 2014.
- ↑ "Historical Census Browser". University of Virginia Library. Retrieved 8 January 2014.
- ↑ "Population of Counties by Decennial Census: 1900 to 1990". United States Census Bureau. Retrieved 8 January 2014.
- ↑ "Census 2000 PHC-T-4. Ranking Tables for Counties: 1990 and 2000" (PDF). United States Census Bureau. Retrieved 8 January 2014.
- ↑ "American FactFinder". United States Census Bureau. Retrieved 14 May 2011.
- 1 2 3 "Profile of General Population and Housing Characteristics: 2010 Demographic Profile Data". United States Census Bureau. Retrieved 6 March 2016.
- ↑ "Population, Housing Units, Area, and Density: 2010 - County". United States Census Bureau. Retrieved 6 March 2016.
- ↑ "Selected Social Characteristics in the United States – 2006-2010 American Community Survey 5-Year Estimates". United States Census Bureau. Retrieved 6 March 2016.
- ↑ "Selected Economic Characteristics – 2006-2010 American Community Survey 5-Year Estimates". United States Census Bureau. Retrieved 6 March 2016.
- ↑ "Dave Leip's Atlas of U.S. Presidential Elections - Compare Maps". uselectionatlas.org. Retrieved 7 March 2015.
- ↑ "2012 Washington state election results". The Seattle Times. Retrieved 7 March 2015.
- ↑ Leip, David. "Dave Leip's Atlas of U.S. Presidential Elections". uselectionatlas.org. Retrieved 10 April 2018.
- ↑ The leading "other" candidate, Progressive Theodore Roosevelt, received 3,061 votes, while Socialist candidate Eugene Debs received 631 votes, Prohibition candidate Eugene Chafin received 617 votes, and Socialist Labor candidate Arthur Reimer received 24 votes.
- ↑ Heart of Washington.com
External links
| Wikisource has the text of the 1879 American Cyclopædia article Whitman. |
- Whitman County official website
- Whitman County Genealogical Society
- Whitman County Historical Society
- Whitman County Library with branches in 14 communities throughout Whitman County.
- Whitman County Heritage A collection of historic materials from the Whitman County Library and local partners.
- Whitman County @ State of Washington Office of Financial Management
- Port of Whitman County and Green IT Alliance (GITA)
Places adjacent to Whitman County, Washington | ||||||||||
|---|---|---|---|---|---|---|---|---|---|---|
| ||||||||||
Municipalities and communities of Whitman County, Washington, United States | ||
|---|---|---|
| Cities | | |
| Towns | ||
| CDP | ||
| Other unincorporated communities | ||
| Ghost towns | ||