Columbia County, Washington
| Columbia County, Washington | |
|---|---|
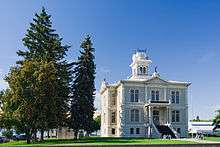
.jpg) Columbia County Courthouse in Dayton | |
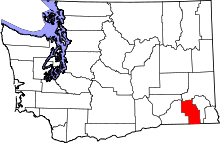 Location in the U.S. state of Washington | |
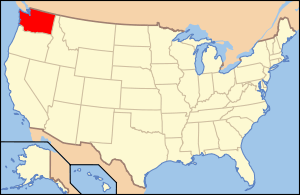 Washington's location in the U.S. | |
| Founded | November 11, 1875 |
| Named for | Columbia River |
| Seat | Dayton |
| Largest city | Dayton |
| Area | |
| • Total | 873 sq mi (2,261 km2) |
| • Land | 869 sq mi (2,251 km2) |
| • Water | 4.9 sq mi (13 km2), 0.6% |
| Population (est.) | |
| • (2017) | 4,047 |
| • Density | 4.6/sq mi (1.8/km2) |
| Congressional district | 5th |
| Time zone | Pacific: UTC−8/−7 |
| Website |
www |
Columbia County is a county located in the U.S. state of Washington. As of the 2010 census, the population was 4,078,[1] making it the third-least populous county in Washington. The county seat and largest city is Dayton. The county was created out of Walla Walla County on November 11, 1875[2] and is named after the Columbia River.
Columbia County is included in the Walla Walla, WA Metropolitan Statistical Area.
Geography
According to the U.S. Census Bureau, the county has a total area of 873 square miles (2,260 km2), of which 869 square miles (2,250 km2) is land and 4.9 square miles (13 km2) (0.6%) is water.[3] It is part of the Palouse, a wide and rolling prairie-like region of the middle Columbia basin.
Geographic features
Major highways
Adjacent counties
- Whitman County - north
- Garfield County - east
- Wallowa County, Oregon - southeast
- Umatilla County, Oregon - southwest
- Walla Walla County - west
- Franklin County - northwest
National protected area
- Umatilla National Forest (part)
Demographics
| Historical population | |||
|---|---|---|---|
| Census | Pop. | %± | |
| 1880 | 7,103 | — | |
| 1890 | 6,709 | −5.5% | |
| 1900 | 7,128 | 6.2% | |
| 1910 | 7,042 | −1.2% | |
| 1920 | 6,093 | −13.5% | |
| 1930 | 5,325 | −12.6% | |
| 1940 | 5,549 | 4.2% | |
| 1950 | 4,860 | −12.4% | |
| 1960 | 4,569 | −6.0% | |
| 1970 | 4,439 | −2.8% | |
| 1980 | 4,057 | −8.6% | |
| 1990 | 4,027 | −0.7% | |
| 2000 | 4,064 | 0.9% | |
| 2010 | 4,078 | 0.3% | |
| Est. 2017 | 4,047 | [4] | −0.8% |
| U.S. Decennial Census[5] 1790–1960[6] 1900–1990[7] 1990–2000[8] 2010–2016[1] | |||
2000 census
As of the census[9] of 2000, there were 4,064 people, 1,687 households, and 1,138 families residing in the county. The population density was 5 people per square mile (2/km²). There were 2,018 housing units at an average density of 2 per square mile (1/km²). The racial makeup of the county was 93.73% White, 0.22% Black or African American, 0.96% Native American, 0.42% Asian, 0.05% Pacific Islander, 2.73% from other races, and 1.89% from two or more races. 6.35% of the population were Hispanic or Latino of any race. 19.6% were of German, 18.2% United States or American, 14.3% English and 8.3% Irish ancestry. 94.3% spoke English and 5.7% Spanish at home.
There were 1,687 households out of which 27.70% had children under the age of 18 living with them, 56.00% were married couples living together, 8.50% had a female householder with no husband present, and 32.50% were non-families. 29.00% of all households were made up of individuals and 13.00% had someone living alone who was 65 years of age or older. The average household size was 2.36 and the average family size was 2.89.
In the county, the population was spread out with 23.90% under the age of 18, 7.00% from 18 to 24, 22.80% from 25 to 44, 27.70% from 45 to 64, and 18.50% who were 65 years of age or older. The median age was 42 years. For every 100 females there were 95.20 males. For every 100 females age 18 and over, there were 94.80 males.
The median income for a household in the county was $33,500, and the median income for a family was $44,038. Males had a median income of $33,690 versus $21,367 for females. The per capita income for the county was $17,374. About 8.60% of families and 12.60% of the population were below the poverty line, including 15.90% of those under age 18 and 11.10% of those age 65 or over.
2010 census
As of the 2010 United States Census, there were 4,078 people, 1,762 households, and 1,156 families residing in the county.[10] The population density was 4.7 inhabitants per square mile (1.8/km2). There were 2,136 housing units at an average density of 2.5 per square mile (0.97/km2).[11] The racial makeup of the county was 93.0% white, 1.4% American Indian, 0.6% Asian, 0.3% Pacific islander, 0.3% black or African American, 1.7% from other races, and 2.7% from two or more races. Those of Hispanic or Latino origin made up 6.2% of the population.[10] In terms of ancestry, 24.7% were German, 18.3% were English, 12.3% were Irish, and 7.0% were American.[12]
Of the 1,762 households, 24.7% had children under the age of 18 living with them, 52.6% were married couples living together, 9.2% had a female householder with no husband present, 34.4% were non-families, and 29.3% of all households were made up of individuals. The average household size was 2.27 and the average family size was 2.76. The median age was 48.3 years.[10]
The median income for a household in the county was $43,611 and the median income for a family was $53,452. Males had a median income of $45,000 versus $35,357 for females. The per capita income for the county was $25,810. About 9.8% of families and 16.4% of the population were below the poverty line, including 19.7% of those under age 18 and 10.9% of those age 65 or over.[13]
Communities
City
- Dayton (county seat)
Town
Unincorporated communities
Politics
Columbia County is one of the most conservative counties in Washington State. It has not been carried by a Democrat for President since Lyndon Johnson's 1964 landslide victory, and the last time it backed a Democrat for Governor was as far back as 1936 when Clarence D. Martin swept every county in the state.[14] Popular, conservative Democratic Senator "Scoop" Jackson did carry the county during four consecutive county sweeps (the last in 1982), but since then it has been powerfully Republican in those contests too.[15]
| Year | Republican | Democratic | Third parties |
|---|---|---|---|
| 2016 | 67.2% 1,497 | 23.6% 526 | 9.2% 206 |
| 2012 | 68.8% 1,568 | 28.3% 645 | 2.9% 67 |
| 2008 | 66.4% 1,499 | 30.4% 686 | 3.2% 73 |
| 2004 | 69.8% 1,470 | 28.7% 605 | 1.5% 32 |
| 2000 | 72.3% 1,523 | 24.4% 515 | 3.3% 69 |
| 1996 | 48.5% 948 | 38.0% 743 | 13.5% 264 |
| 1992 | 39.8% 761 | 34.9% 668 | 25.3% 485 |
| 1988 | 60.3% 1,172 | 37.6% 730 | 2.2% 42 |
| 1984 | 67.0% 1,404 | 32.1% 673 | 0.9% 18 |
| 1980 | 64.7% 1,349 | 28.1% 587 | 7.2% 150 |
| 1976 | 56.7% 1,153 | 40.8% 829 | 2.6% 52 |
| 1972 | 69.5% 1,445 | 25.6% 533 | 4.9% 102 |
| 1968 | 56.7% 1,221 | 35.0% 754 | 8.2% 177 |
| 1964 | 47.9% 1,048 | 52.0% 1,138 | 0.1% 1 |
| 1960 | 62.1% 1,301 | 37.9% 793 | |
| 1956 | 65.8% 1,423 | 34.2% 739 | |
| 1952 | 66.2% 1,511 | 33.5% 765 | 0.3% 7 |
| 1948 | 50.3% 1,062 | 48.1% 1,015 | 1.7% 35 |
| 1944 | 53.4% 1,211 | 45.8% 1,039 | 0.9% 20 |
| 1940 | 54.4% 1,461 | 45.4% 1,218 | 0.2% 6 |
| 1936 | 33.5% 807 | 57.7% 1,391 | 8.9% 214 |
| 1932 | 31.1% 714 | 64.9% 1,491 | 4.1% 93 |
| 1928 | 65.1% 1,328 | 33.8% 689 | 1.2% 24 |
| 1924 | 52.1% 1,122 | 24.3% 522 | 23.6% 509 |
| 1920 | 64.2% 1,376 | 30.9% 662 | 4.9% 106 |
| 1916 | 46.9% 1,148 | 47.6% 1,164 | 5.5% 135 |
| 1912 | 26.3% 673 | 33.4% 855 | 40.4% 1,036[lower-alpha 1] |
| 1908 | 57.4% 887 | 37.9% 585 | 4.7% 73 |
| 1904 | 65.7% 1,089 | 29.1% 482 | 5.2% 86 |
| 1900 | 54.7% 899 | 43.0% 706 | 2.3% 38 |
| 1896 | 47.0% 776 | 52.2% 862 | 0.8% 13 |
| 1892 | 39.3% 615 | 42.9% 672 | 17.8% 278 |
See also
Notes
- ↑ The leading "other" candidate, Progressive Theodore Roosevelt, received 803 votes, while Socialist candidate Eugene Debs received 172 votes, Prohibition candidate Eugene Chafin received 59 votes, and Socialist Labor candidate Arthur Reimer received 2 votes.
References
- 1 2 "State & County QuickFacts". United States Census Bureau. Retrieved January 7, 2014.
- ↑ "Milestones for Washington State History — Part 2: 1851 to 1900". HistoryLink.org. 2003-03-06.
- ↑ "2010 Census Gazetteer Files". United States Census Bureau. August 22, 2012. Retrieved July 4, 2015.
- ↑ "Population and Housing Unit Estimates". Retrieved Apr 4, 2018.
- ↑ "U.S. Decennial Census". United States Census Bureau. Archived from the original on May 12, 2015. Retrieved January 7, 2014.
- ↑ "Historical Census Browser". University of Virginia Library. Retrieved January 7, 2014.
- ↑ "Population of Counties by Decennial Census: 1900 to 1990". United States Census Bureau. Retrieved January 7, 2014.
- ↑ "Census 2000 PHC-T-4. Ranking Tables for Counties: 1990 and 2000" (PDF). United States Census Bureau. Retrieved January 7, 2014.
- ↑ "American FactFinder". United States Census Bureau. Archived from the original on 2013-09-11. Retrieved 2011-05-14.
- 1 2 3 "DP-1 Profile of General Population and Housing Characteristics: 2010 Demographic Profile Data". United States Census Bureau. Retrieved 2016-03-01.
- ↑ "Population, Housing Units, Area, and Density: 2010 - County". United States Census Bureau. Retrieved 2016-03-01.
- ↑ "DP02 SELECTED SOCIAL CHARACTERISTICS IN THE UNITED STATES – 2006-2010 American Community Survey 5-Year Estimates". United States Census Bureau. Retrieved 2016-03-01.
- ↑ "DP03 SELECTED ECONOMIC CHARACTERISTICS – 2006-2010 American Community Survey 5-Year Estimates". United States Census Bureau. Retrieved 2016-03-01.
- ↑ David Leip. "Gubernatorial General Election Map Comparison – Washington". Dave Leip's U.S. Election Atlas.
- ↑ David Leip. "Senatorial General Election Map Comparison – Washington". Dave Leip's U.S. Election Atlas.
- ↑ Leip, David. "Dave Leip's Atlas of U.S. Presidential Elections". uselectionatlas.org. Retrieved 2018-04-06.
Further reading
- Frank T. Gilbert, Historic Sketches: Walla Walla, Columbia and Garfield Counties, Washington Territory. Portland, OR: A.G. Walling Printing House, 1882.
- W.D. Lyman, Lyman's History of Old Walla Walla County, Embracing Walla Walla, Columbia, Garfield and Asotin Counties. In Two Volumes. Chicago: S.J. Clarke Publishing Co., 1918. Volume 1 | Volume 2
- Frederic Ambrose Shaver, An Illustrated History of Southeastern Washington, Including Walla Walla, Columbia, Garfield and Asotin Counties, Washington. Spokane, WA: Western Historical Publishing Co., 1906.
External links
| Wikimedia Commons has media related to Columbia County, Washington. |
Places adjacent to Columbia County, Washington | ||||||||||
|---|---|---|---|---|---|---|---|---|---|---|
| ||||||||||
Municipalities and communities of Columbia County, Washington, United States | ||
|---|---|---|
| City | | |
| Town | ||
| Unicorporated communities | ||
| Ghost towns | ||