Seattle metropolitan area
| Seattle metropolitan area | |
|---|---|
| Seattle–Tacoma–Bellevue | |
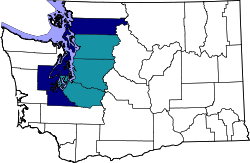 A map of the Seattle MSA. The Seattle MSA is highlighted in teal, the CSA in navy blue. | |
| Coordinates: 47°44′N 122°19′W / 47.74°N 122.32°W | |
| Country | United States |
| State(s) | Washington |
| Largest city | Seattle (713,700) |
| Other cities |
- Tacoma (211,277) - Bellevue (141,400) - Kent (127,514) - Everett (109,043) - Renton (104,000) |
| Area | |
| • Total | 5,872.35 sq mi (15,209.3 km2) |
| Highest elevation | 14,411 ft (4,392 m) |
| Lowest elevation | 0 ft (0 m) |
| Population | |
| • Total | 3,867,046 |
| • Rank | 14th in the U.S. |
| • Density | 659/sq mi (250/km2) |
The Seattle metropolitan area is located in the U.S. state of Washington and includes the three most populous counties—King, Snohomish, and Pierce—within the greater Puget Sound region. The United States Census Bureau officially defines the metropolitan area as the Seattle–Tacoma–Bellevue, WA Metropolitan Statistical Area. With an estimated population of 3,867,046 as of 2017,[1] it is the 14th largest Metropolitan Statistical Area in the United States, with slightly more than half of Washington's population.
As defined by the United States Census Bureau, the Seattle metropolitan area is made up of the following (see Fig. STB):
- Seattle–Bellevue–Everett metropolitan division
- King County: Seattle and its immediate vicinity
- Snohomish County: north of Seattle
- Tacoma metropolitan division
- Pierce County: south of Seattle
Based on commuting patterns, the adjacent metropolitan areas of Olympia, Bremerton, and Mount Vernon, along with a few smaller satellite urban areas, are grouped together in a wider labor market region known as the Seattle–Tacoma–Olympia Combined Statistical Area (CSA) (See Figure STO), commonly known as the Puget Sound region. The population of this wider region is 4,686,536—roughly two-thirds of Washington's population—as of 2017.[1] The Seattle CSA is the 12th largest CSA, and the 13th largest primary census statistical area in the country. The additional metropolitan and micropolitan areas included are:
- Bremerton–Silverdale metropolitan area
- Kitsap County: west of Seattle, separated from the city by Puget Sound; connected to Seattle by ferry and to Tacoma by the Tacoma Narrows Bridge
- Olympia metropolitan area
- Thurston County: southwest of Seattle, at the south end of Puget Sound
- Mount Vernon–Anacortes metropolitan area
- Oak Harbor micropolitan area
- Island County: northwest of Everett, encompassing Whidbey and Camano Islands in Puget Sound
- Shelton micropolitan area
- Mason County: west of Tacoma and northwest of Olympia
Census statistics
| Historical population | |||
|---|---|---|---|
| Census | Pop. | %± | |
| 1870 | 4,128 | — | |
| 1880 | 11,616 | 181.4% | |
| 1890 | 123,443 | 962.7% | |
| 1900 | 189,518 | 53.5% | |
| 1910 | 464,659 | 145.2% | |
| 1920 | 601,090 | 29.4% | |
| 1930 | 706,220 | 17.5% | |
| 1940 | 775,815 | 9.9% | |
| 1950 | 1,120,448 | 44.4% | |
| 1960 | 1,428,803 | 27.5% | |
| 1970 | 1,832,896 | 28.3% | |
| 1980 | 2,093,112 | 14.2% | |
| 1990 | 2,559,164 | 22.3% | |
| 2000 | 3,043,878 | 18.9% | |
| 2010 | 3,439,809 | 13.0% | |
| Est. 2017 | 3,867,046 | 12.4% | |
| U.S. Decennial Census 2015 estimate | |||
As of the 2010 census, there were 3,439,809 people, 1,357,475 households, and 845,966 families residing within the MSA. The racial makeup of the MSA were as followed:[2][3]
- White: 71.9% (68.0% non-Hispanic white)
- Black or African American: 5.6%
- American Indian and Alaskan Native: 1.1%
- Asian: 11.4% (2.3% Chinese, 2.0% Filipino, 1.6% Vietnamese, 1.5% Indian, 1.5% Korean, 0.8% Japanese, 0.5% Cambodian, 0.2% Laotian, 0.1% Thai, 0.1% Pakistani, 0.1% Indonesian)
- Pacific Islander: 0.8% (0.3% Samoan, 0.2% Guamanian or Chamorro, 0.1% Native Hawaiian)
- Two or more races: 5.3%
- Some other race: 3.8%
- Hispanic or Latino (of any race): 9.0% (6.4% Mexican, 0.5% Puerto Rican, 0.4% Spanish or Spaniard, 0.2% Salvadoran, 0.1% Guatemalan, 0.1% Peruvian)
In 2010 the median income for a household in the MSA was $63,088 and the median income for a family was $76,876. The per capita income was $32,401.[4]
| County | 2017 Estimate | 2010 Census | Change | Area | Density |
|---|---|---|---|---|---|
| King County | 2,188,649 | 1,931,249 | +13.33% | 2,115.56 sq mi (5,479.3 km2) | 1,035/sq mi (399/km2) |
| Pierce County | 876,764 | 795,225 | +10.25% | 1,669.51 sq mi (4,324.0 km2) | 525/sq mi (203/km2) |
| Snohomish County | 801,633 | 713,335 | +12.38% | 2,087.27 sq mi (5,406.0 km2) | 384/sq mi (148/km2) |
| Total | 3,867,046 | 3,439,809 | +12.42% | 5,872.34 sq mi (15,209.3 km2) | 659/sq mi (254/km2) |
Religion
According to the Pew Research Center's 2014 U.S. Religious Landscape Study, the Seattle metropolitan area's religious affiliation is as follows:[5]
- Christian: 52%
- Protestant Christian: 34%
- Catholic Christian: 15%
- Other Christian: 3%
- Non-Christian faiths: 10%
- Buddhist: 2%
- Hindu: 2%
- Judaism: 1%
- Islam: Less than 1%
- Other faiths: 4%
- Unaffiliated: 37%
- Don't Know: 1%
Cities


- Major
- Other
- Arlington
- Auburn
- Bainbridge Island
- Beaux Arts Village
- Bonney Lake
- Bothell
- Bremerton
- Brier
- Burien
- Covington
- Des Moines
- Duvall
- Enumclaw
- Edmonds
- Federal Way
- Gig Harbor
- Gold Bar
- Granite Falls
- Issaquah
- Kenmore
- Kent
- Kirkland
- Lake Forest Park
- Lake Stevens
- Lakewood
- Lynnwood
- Maple Valley
- Marysville
- Mercer Island
- Mill Creek
- Monroe
- Mountlake Terrace
- Mount Vernon
- Mukilteo
- Newcastle
- Normandy Park
- Puyallup
- Poulsbo
- Redmond
- Renton
- Sammamish
- SeaTac
- Shoreline
- Silverdale
- Snohomish
- Stanwood
- Sultan
- Tukwila
- Woodinville
- Woodway
Transportation
Major airports
Major highways
Mass transit
- Sound Transit, trains, buses, light rail in Puget Sound area
- Community Transit, buses in Snohomish County except Everett
- King County Metro, buses in King County
- Pierce Transit, buses in Pierce County
- Everett Transit, bus service in the city of Everett
- Intercity Transit, bus service in Thurston County
- Mason Transit Authority, bus service in Mason County
- Seattle Streetcar, streetcar service in the city of Seattle
References
- 1 2 Bureau, U.S. Census. "American FactFinder - Results". factfinder.census.gov.
- ↑ Bureau, U.S. Census. "American FactFinder - Results". factfinder.census.gov.
- ↑ Bureau, U.S. Census. "American FactFinder - Results". factfinder.census.gov.
- ↑ Bureau, U.S. Census. "American FactFinder - Results". factfinder.census.gov.
- ↑ "Religious Landscape Study". Pew Research Center's Religion & Public Life Project. Retrieved 2015-11-10.