Grant County, Washington
| Grant County, Washington | ||
|---|---|---|
 | ||
| ||
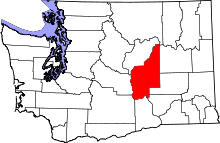 Location in the U.S. state of Washington | ||
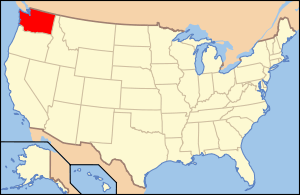 Washington's location in the U.S. | ||
| Founded | 24 February, 1909 | |
| Named for | Ulysses S. Grant | |
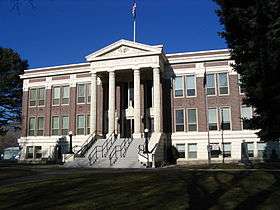
| Seat | Ephrata | |
| Largest city | Moses Lake | |
| Area | ||
| • Total | 2,791 sq mi (7,229 km2) | |
| • Land | 2,680 sq mi (6,941 km2) | |
| • Water | 112 sq mi (290 km2), 4.0% | |
| Population (est.) | ||
| • (2017) | 95,158 | |
| • Density | 35/sq mi (14/km2) | |
| Congressional district | 4th | |
| Time zone | Pacific: UTC−8/−7 | |
| Website |
www | |

Grant County is a county located in the U.S. state of Washington. As of the 2010 census, the population was 89,120.[1] The county seat is Ephrata,[2] and the largest city is Moses Lake. The county was formed out of Douglas County in February 1909[3] and is named for U.S. President Ulysses S. Grant.
Grant County comprises the Moses Lake, WA Micropolitan Statistical Area, which is also part of the Moses Lake-Othello, WA Combined Statistical Area.
History
Native American cultures in the area included the Interior Salish, Wenatchi, and Okanagan. The first white settlers began to arrive in the mid-to-late-19th century, primarily with the goal of raising livestock. One government official described the area in 1879 as, "…a desolation where even the most hopeful can find nothing in its future prospects to cheer."[4]
When railroads arrived they also brought new settlers, and the economy began a shift from ranching to dryland farming. This transition required the people to have ready access to water, and irrigation became a necessity. The first large-scale irrigation attempts began in 1898, but it would be years before real success.
With the influx of dryland farming, the county soon boasted access to three major railway systems; the Great Northern Railway, Northern Pacific Railroad and the Chicago, Milwaukee & St. Paul Railroad. In addition, the Columbia River in this area was navigable. This allowed crops to be transported out of the area easily. Towns like Wilson Creek, Quincy and Ephrata began to thrive.
The Washington State Legislature officially created Grant County on 24 February 1909, naming it in the memory of Ulysses S. Grant, the 18th president of the United States, and a major contributor to the Union victory in the American Civil War. The county seat was located in Ephrata. The area's population at the time stood at around 8700 people.
The Columbia Basin Project, which ultimately produced the Grand Coulee Dam with its associated irrigation and hydroelectric generating grid, was an outgrowth of the 1902 creation of the United States Bureau of Reclamation. When that agency began studying feasibility of projects in the Northwestern United States, competing groups from Spokane, Wenatchee, Ephrata and elsewhere advanced competing possibilities. One idea was to dam the Columbia River at Grand Coulee. This concept was approved in 1933, and construction continued in the following decades. The project would fundamentally change the region forever.[5][6][7]
Geography
According to the U.S. Census Bureau, the county has a total area of 2,791 square miles (7,230 km2), of which 2,680 square miles (6,900 km2) is land and 112 square miles (290 km2) (4.0%) is water.[8] It is the fourth-largest county in Washington by area.
The environmental climate of Grant County is characterized by hot summers and cold winters. Rainshadow caused by the Cascade mountains separates eastern Washington, including Grant County, from western Washington's more temperate and oceanic climate.
A sign alongside Interstate Highway I-90 where it enters Grant County welcomes travelers to Grant County and says the county is "The nation's leading potato producing county".
Geographic features
- Columbia River
- Moses Lake
- Potholes Reservoir
- Grand Coulee
- Ulysses S. Peak, unofficial name of county high point
Major highways
Adjacent counties
- Douglas County - north
- Okanogan County - northeast
- Adams County - east
- Lincoln County - east
- Franklin County - southeast
- Benton County - south
- Yakima County - southwest
- Kittitas County - west
National protected areas
Demographics
| Historical population | |||
|---|---|---|---|
| Census | Pop. | %± | |
| 1910 | 8,698 | — | |
| 1920 | 7,771 | −10.7% | |
| 1930 | 5,666 | −27.1% | |
| 1940 | 14,668 | 158.9% | |
| 1950 | 24,346 | 66.0% | |
| 1960 | 46,477 | 90.9% | |
| 1970 | 41,881 | −9.9% | |
| 1980 | 48,522 | 15.9% | |
| 1990 | 54,758 | 12.9% | |
| 2000 | 74,698 | 36.4% | |
| 2010 | 89,120 | 19.3% | |
| Est. 2017 | 95,158 | [9] | 6.8% |
| U.S. Decennial Census[10] 1790–1960[11] 1900–1990[12] 1990–2000[13] 2010–2016[1] | |||
2000 census
As of the 2000 census,[14] there were 74,698 people, 25,204 households and 18,676 families residing in the county. The population density was 28 per square mile (11/km²). There were 29,081 housing units at an average density of 11 per square mile (4/km²). The racial makeup of the county was 76.54% White, 0.99% Black or African American, 1.16% Native American, 0.87% Asian, 0.07% Pacific Islander, 17.36% from other races, and 3.01% from two or more races. 30.09% of the population were Hispanic or Latino of any race. 15.1% were of German, 8.1% United States or American, 8.0% English and 5.4% Irish ancestry. 72.0% spoke English and 25.3% Spanish as their first language.
There were 25,204 households of which 39.90% had children under the age of 18 living with them, 59.30% were married couples living together, 9.80% had a female householder with no husband present, and 25.90% were non-families. 21.20% of all households were made up of individuals and 8.90% had someone living alone who was 65 years of age or older. The average household size was 2.92 and the average family size was 3.38.
32.00% of the population were under the age of 18, 9.80% from 18 to 24, 27.00% from 25 to 44, 19.70% from 45 to 64, and 11.50% who were 65 years of age or older. The median age was 31 years. For every 100 females there were 104.50 males. For every 100 females age 18 and over, there were 103.40 males.
The median household income $35,276, and the median family income was $38,938. Males had a median income of $32,414 versus $24,310 for females. The per capita income for the county was $15,037. About 13.10% of families and 17.40% of the population were below the poverty line, including 22.30% of those under age 18 and 9.40% of those age 65 or over.
2010 census
As of the 2010 United States Census, there were 89,120 people, 30,041 households, and 21,800 families residing in the county.[15] The population density was 33.3 inhabitants per square mile (12.9/km2). There were 35,083 housing units at an average density of 13.1 per square mile (5.1/km2).[16] The racial makeup of the county was 72.8% white, 1.2% American Indian, 1.1% black or African American, 0.9% Asian, 0.1% Pacific islander, 20.4% from other races, and 3.5% from two or more races. Those of Hispanic or Latino origin made up 38.3% of the population.[15] In terms of ancestry, 15.5% were German, 8.9% were English, 7.1% were Irish, and 3.9% were American.[17]
Of the 30,041 households, 40.6% had children under the age of 18 living with them, 54.7% were married couples living together, 11.5% had a female householder with no husband present, 27.4% were non-families, and 22.0% of all households were made up of individuals. The average household size was 2.93 and the average family size was 3.40. The median age was 32.1 years.[15]
The median income for a household in the county was $42,572 and the median income for a family was $50,065. Males had a median income of $39,530 versus $27,417 for females. The per capita income for the county was $19,718. About 15.7% of families and 20.4% of the population were below the poverty line, including 28.4% of those under age 18 and 7.2% of those age 65 or over.[18]
Communities
Cities
- Electric City
- Ephrata (county seat)
- George
- Grand Coulee
- Mattawa
- Moses Lake
- Quincy
- Royal City
- Soap Lake
- Warden
Towns
- Coulee City
- Coulee Dam (partial)
- Hartline
- Krupp (formally known as Marlin)
- Wilson Creek
Census-designated places
Unincorporated communities
Politics
| Year | Republican | Democratic | Third parties |
|---|---|---|---|
| 2016 | 63.3% 18,518 | 26.7% 7,810 | 10.0% 2,930 |
| 2012 | 64.2% 17,852 | 32.2% 8,950 | 3.7% 1,027 |
| 2008 | 62.1% 17,153 | 34.7% 9,601 | 3.2% 880 |
| 2004 | 68.5% 17,799 | 29.9% 7,779 | 1.6% 417 |
| 2000 | 66.5% 15,830 | 29.7% 7,073 | 3.8% 895 |
| 1996 | 49.8% 10,895 | 36.9% 8,065 | 13.3% 2,906 |
| 1992 | 43.4% 9,503 | 33.2% 7,278 | 23.4% 5,140 |
| 1988 | 57.8% 10,859 | 40.2% 7,564 | 2.0% 376 |
| 1984 | 65.8% 12,888 | 32.2% 6,298 | 2.0% 398 |
| 1980 | 61.3% 11,152 | 31.2% 5,673 | 7.5% 1,371 |
| 1976 | 51.9% 9,192 | 43.9% 7,777 | 4.2% 752 |
| 1972 | 59.3% 9,370 | 34.7% 5,487 | 6.1% 957 |
| 1968 | 48.8% 7,007 | 40.2% 5,773 | 11.1% 1,587 |
| 1964 | 42.0% 6,065 | 57.9% 8,352 | 0.1% 10 |
| 1960 | 50.4% 7,568 | 49.3% 7,400 | 0.3% 37 |
| 1956 | 48.7% 6,603 | 51.2% 6,938 | 0.1% 8 |
| 1952 | 50.6% 4,512 | 49.1% 4,381 | 0.3% 22 |
| 1948 | 33.2% 2,081 | 64.8% 4,067 | 2.1% 129 |
| 1944 | 39.2% 1,530 | 60.3% 2,354 | 0.5% 18 |
| 1940 | 26.6% 1,487 | 73.2% 4,097 | 0.3% 17 |
| 1936 | 13.0% 694 | 85.6% 4,560 | 1.4% 74 |
| 1932 | 34.9% 840 | 57.1% 1,376 | 8.1% 194 |
| 1928 | 68.1% 1,407 | 31.0% 641 | 0.9% 19 |
| 1924 | 40.9% 813 | 16.7% 332 | 42.4% 844 |
| 1920 | 58.2% 1,378 | 28.9% 684 | 12.9% 304 |
| 1916 | 39.8% 1,205 | 51.6% 1,563 | 8.7% 262 |
| 1912 | 17.4% 458 | 29.3% 771 | 53.3% 1,401 |
See also
References
- 1 2 "State & County QuickFacts". United States Census Bureau. Retrieved 7 January 2014.
- ↑ "Find a County". National Association of Counties. Archived from the original on 31 May 2011. Retrieved 7 June 2011.
- ↑ "Milestones for Washington State History — Part 3: 1901 to 1950". HistoryLink.org. 6 March 2003.
- ↑ Symons, Lieut. Thomas W. Report of an Examination of the Upper Columbia River and the Territory in Its Vicinity in September and October 1881, to Determine Its Navigability, and Adaptability to Steamboat Transportation: Made by Direction of the Commanding General of the Department of the Columbia. p. 121.
- ↑ "Grant County - Thumbnail History". Retrieved 6 April 2018.
- ↑ "Great Grant County – News from the best county in the world!". greatgrantcounty.com. Retrieved 6 April 2018.
- ↑ "North Central Washington in the 1900s". ncwportal.com. Retrieved 6 April 2018.
- ↑ "2010 Census Gazetteer Files". United States Census Bureau. 22 August 2012. Retrieved 5 July 2015.
- ↑ "Population and Housing Unit Estimates". Retrieved 4 April 2018.
- ↑ "U.S. Decennial Census". United States Census Bureau. Archived from the original on 12 May 2015. Retrieved 7 January 2014.
- ↑ "Historical Census Browser". University of Virginia Library. Retrieved 7 January 2014.
- ↑ "Population of Counties by Decennial Census: 1900 to 1990". United States Census Bureau. Retrieved 7 January 2014.
- ↑ "Census 2000 PHC-T-4. Ranking Tables for Counties: 1990 and 2000" (PDF). United States Census Bureau. Retrieved 7 January 2014.
- ↑ "American FactFinder". United States Census Bureau. Archived from the original on 11 September 2013. Retrieved 14 May 2011.
- 1 2 3 "Profile of General Population and Housing Characteristics: 2010 Demographic Profile Data". United States Census Bureau. Retrieved 6 March 2016.
- ↑ "Population, Housing Units, Area, and Density: 2010 - County". United States Census Bureau. Retrieved 6 March 2016.
- ↑ "Selected Social Characteristics in the United States – 2006-2010 American Community Survey 5-Year Estimates". United States Census Bureau. Retrieved 6 March 2016.
- ↑ "Selected Economic Characteristics – 2006-2010 American Community Survey 5-Year Estimates". United States Census Bureau. Retrieved 6 March 2016.
- ↑ Leip, David. "Dave Leip's Atlas of U.S. Presidential Elections". uselectionatlas.org. Retrieved 6 April 2018.
External links
Places adjacent to Grant County, Washington | ||||||||||
|---|---|---|---|---|---|---|---|---|---|---|
| ||||||||||
Municipalities and communities of Grant County, Washington, United States | ||
|---|---|---|
| Cities | | |
| Towns | ||
| CDPs | ||
| Other unincorporated communities | ||
| Ghost towns | ||
| Footnotes | ‡This populated place also has portions in an adjacent county or counties | |