Spokane metropolitan area
| Spokane metropolitan area | |
|---|---|
| Spokane–Spokane Valley | |
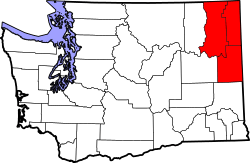 A map of the Spokane MSA. | |
| Country | United States |
| State(s) | Washington |
| Largest city | Spokane (213,272) |
| Other cities |
- Spokane Valley (94,919) - Cheney (11,534) - Liberty Lake (8,906) - Airway Heights (6,639) |
| Area | |
| • Total | 5,641.5 sq mi (14,611 km2) |
| Highest elevation | 7,320 ft (2,230 m) |
| Lowest elevation | 1,273 ft (338 m) |
| Population | |
| • Total | 556,634 |
| • Rank | 98th in the U.S. |
| • Density | 97/sq mi (37/km2) |
The Spokane–Spokane Valley Metropolitan Statistical Area, as defined by the United States Census Bureau, is an area consisting of Spokane, Stevens, and Pend Oreille Counties in Washington State, anchored by the city of Spokane and its largest suburb, Spokane Valley. As of 2016 the MSA had a population of 556,634. The Spokane Metropolitan Area and the neighboring Coeur d'Alene metropolitan area, make up the larger Spokane–Coeur d'Alene combined statistical area. The urban areas of the two MSAs largely follow the path of Interstate 90 between Spokane and Coeur d'Alene. In 2010, the Spokane–Spokane Valley MSA had a gross metropolitan product of $20.413 billion.[1]
Counties
Communities
Over 200,000 inhabitants
- Spokane - (principal city)
50,001 to 200,000 inhabitants
- Spokane Valley - (principal city)
10,001 to 50,000 inhabitants
5,001 to 10,000 inhabitants
1,001 to 5,000 inhabitants
1,000 inhabitants or fewer
Unincorporated places
- Amber
- Arden
- Bluecreek
- Cedonia
- Chattaroy
- Colbert
- Diamond Lake
- Echo
- Elk
- Espanola
- Evans
- Ford
- Four Lakes
- Freedom
- Fruitland
- Gifford
- Green Bluff
- Greenacres
- Hunters
- Jared
- Lakeside
- Locke
- Marshall
- Mead
- Mica
- Milan
- Newman Lake
- Nine Mile Falls
- Onion Creek
- Plaza
- Rice
- Ruby
- Spokane Bridge
- Suncrest (part of Nine Mile Falls)
- Tiger
- Tumtum (also known as Tum Tum)
- Tyler
- Usk
- Valleyford
- Wellpinit
Demographics
As of 2013, there were 535,189 people and 208,513 households residing within the MSA. The racial makeup of the MSA was 86% White, 2% Black, 1% Native, 2% Asian, 0% Islander, and 5% Hispanic. According to the Association of Religion Data Archives' 2010 Metro Area Membership Report, the denominational affiliations of the Spokane MSA are 64,277 Evangelical Protestant, 682 Black Protestant, 24,826 Mainline Protestant, 754 Orthodox, 66,202 Catholic, 31,674 Other, and 339,338 Unclaimed.[2]
The median income for a household in the MSA was $47,485. The per capita income for the MSA was $24,559.[3]
| Historical population | |||
|---|---|---|---|
| Census | Pop. | %± | |
| 1860 | 1,992 | — | |
| 1870 | 2,734 | 37.2% | |
| 1880 | 5,507 | 101.4% | |
| 1890 | 41,828 | 659.5% | |
| 1900 | 68,058 | 62.7% | |
| 1910 | 164,701 | 142.0% | |
| 1920 | 169,257 | 2.8% | |
| 1930 | 176,182 | 4.1% | |
| 1940 | 191,083 | 8.5% | |
| 1950 | 247,554 | 29.6% | |
| 1960 | 303,131 | 22.5% | |
| 1970 | 310,197 | 2.3% | |
| 1980 | 379,394 | 22.3% | |
| 1990 | 401,227 | 5.8% | |
| 2000 | 469,737 | 17.1% | |
| 2010 | 527,753 | 12.4% | |
| Est. 2016 | 556,634 | 5.5% | |
See also
References
- ↑ "GDP & Personal Income". United States Department of Commerce: Bureau of Economic Analysis. Retrieved April 10, 2018.
- ↑ "Spokane-Spokane Valley, WA". Metro-Area Membership Report. The Association of Religion Data Archives, Pennsylvania State University. 2010. Retrieved January 2, 2014.
- ↑ "Census Reporter". United States Census Bureau. Retrieved 2015-08-31.