Thurston County, Washington
| Thurston County, Washington | |
|---|---|
.jpg) Former Thurston County Courthouse | |
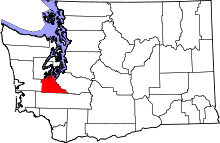 Location in the U.S. state of Washington | |
 Washington's location in the U.S. | |
| Founded | January 12, 1852 |
| Named for | Samuel Thurston |
| Seat | Olympia |
| Largest city | Olympia |
| Area | |
| • Total | 774 sq mi (2,005 km2) |
| • Land | 722 sq mi (1,870 km2) |
| • Water | 52 sq mi (135 km2), 6.7% |
| Population (est.) | |
| • (2017) | 280,588 |
| • Density | 368/sq mi (142/km2) |
| Congressional districts | 3rd, 10th |
| Time zone | Pacific: UTC−8/−7 |
| Website |
www |
Thurston County is a county located in the U.S. state of Washington. As of the 2010 census, its population was 252,264.[1] The county seat and largest city is Olympia,[2] the state capital.
Thurston County was created out of Lewis County by the government of Oregon Territory on January 12, 1852. At that time, it covered all of the Puget Sound region and the Olympic Peninsula. On December 22 of the same year, Pierce, King, Island, and Jefferson counties were split off from Thurston County.[3][4] It is named after Samuel R. Thurston, the Oregon Territory's first delegate to Congress.[5]
Thurston County comprises the Olympia-Tumwater, WA Metropolitan Statistical Area and is included in the Seattle-Tacoma, WA Combined Statistical Area.
Geography
According to the U.S. Census Bureau, the county has a total area of 774 square miles (2,000 km2), of which 722 square miles (1,870 km2) is land and 52 square miles (130 km2) (6.7%) is water.[6]
Major watersheds: Black River, Budd/Deschutes, Chehalis River, Eld Inlet, Henderson Inlet, Nisqually River, Skookumchuck River, Totten Inlet and West Capitol Forest.
Geographic features
- Alder Lake
- Bald Hill Lake
- Barnes Lake
- Bass Lake
- Bigelow Lake
- Black Lake
- Black River
- Budd Inlet
- Capitol Lake
- Capitol Peak
- Capitol State Forest
- Chambers Lake
- Chehalis River
- Clear Lake
- Coopers Pothole
- Deep Lake
- Deschutes River
- Elbow Lake
- Eld Inlet
- Fifteen Lake
- Gehrke Lake
- Grass Lake
- Henderson Inlet
- Hewitt Lake
- Hicks Lake
- Lake Lawrence
- Lois Lake
- Long Lake
- McIntosh Lake
- Mima Mounds
- Munn Lake
- Nisqually River
- Offut Lake
- Patterson Lake
- Puget Sound
- Reichel Lake
- Saint Clair Lake
- Scott Lake
- Simmons Lake
- Skookumchuck River
- Smith Lake
- Southwick Lake
- Springer Lake
- Summit Lake
- Susan Lake
- Totten Inlet
- Trails End Lake
- Trosper Lake
- Ward Lake
Major highways
Adjacent counties
- Pierce County – northeast
- Lewis County – south
- Grays Harbor County – west
- Mason County – north/northwest
National protected areas
Demographics
| Historical population | |||
|---|---|---|---|
| Census | Pop. | %± | |
| 1860 | 1,507 | — | |
| 1870 | 2,246 | 49.0% | |
| 1880 | 3,270 | 45.6% | |
| 1890 | 9,675 | 195.9% | |
| 1900 | 9,927 | 2.6% | |
| 1910 | 17,581 | 77.1% | |
| 1920 | 22,366 | 27.2% | |
| 1930 | 31,351 | 40.2% | |
| 1940 | 37,285 | 18.9% | |
| 1950 | 44,884 | 20.4% | |
| 1960 | 55,049 | 22.6% | |
| 1970 | 76,894 | 39.7% | |
| 1980 | 124,264 | 61.6% | |
| 1990 | 161,238 | 29.8% | |
| 2000 | 207,355 | 28.6% | |
| 2010 | 252,264 | 21.7% | |
| Est. 2017 | 280,588 | [7] | 11.2% |
| U.S. Decennial Census[8] 1790–1960[9] 1900–1990[10] 1990–2000[11] 2010–2016[1] | |||
2000 census
As of the census[12] of 2000, there were 207,355 people, 81,625 households and 54,933 families residing in the county. The population density was 285 per square mile (110/km²). There were 86,652 housing units at an average density of 119 per square mile (46/km²). The racial makeup of the county was 85.66% White, 2.35% Black or African American, 1.52% Native American, 4.41% Asian, 0.52% Pacific Islander, 1.69% from other races, and 3.85% from two or more races. 4.53% of the population were Hispanic or Latino of any race. 17.1% were of German, 10.2% English, 9.8% Irish, 6.9% United States or American and 5.5% Norwegian ancestry.
There were 81,625 households of which 33.00% had children under the age of 18 living with them, 53.10% were married couples living together, 10.30% had a female householder with no husband present, and 32.70% were non-families. 25.10% of all households were made up of individuals and 8.00% had someone living alone who was 65 years of age or older. The average household size was 2.50 and the average family size was 2.99.
Age distribution was 25.30% under the age of 18, 9.30% from 18 to 24, 29.30% from 25 to 44, 24.60% from 45 to 64, and 11.40% who were 65 years of age or older. The median age was 36 years. For every 100 females, there were 96.00 males. For every 100 females age 18 and over, there were 92.70 males.
The median household income was $46,975, and the median family income was $55,027. Males had a median income of $40,521 versus $30,368 for females. The per capita income for the county was $22,415. About 5.80% of families and 8.80% of the population were below the poverty line, including 9.80% of those under age 18 and 5.00% of those age 65 or over.
2010 census
As of the 2010 United States Census, there were 252,264 people, 100,650 households, and 66,161 families residing in the county.[13] The population density was 349.4 inhabitants per square mile (134.9/km2). There were 108,182 housing units at an average density of 149.8 per square mile (57.8/km2).[14] The racial makeup of the county was 82.4% white, 5.2% Asian, 2.7% black or African American, 1.4% American Indian, 0.8% Pacific islander, 2.2% from other races, and 5.3% from two or more races. Those of Hispanic or Latino origin made up 7.1% of the population.[13] In terms of ancestry, 21.2% were German, 13.4% were English, 13.2% were Irish, 5.0% were Norwegian, and 4.7% were American.[15]
Of the 100,650 households, 31.7% had children under the age of 18 living with them, 49.9% were married couples living together, 11.4% had a female householder with no husband present, 34.3% were non-families, and 25.9% of all households were made up of individuals. The average household size was 2.46 and the average family size was 2.95. The median age was 38.5 years.[13]
The median income for a household in the county was $60,930 and the median income for a family was $71,833. Males had a median income of $53,679 versus $41,248 for females. The per capita income for the county was $29,707. About 7.1% of families and 10.3% of the population were below the poverty line, including 13.0% of those under age 18 and 5.9% of those age 65 or over.[16]
Education
School Districts in Thurston County:
- North Thurston
- Olympia
- Rainier
- Centralia
- Rochester
- Tenino
- Tumwater
- Yelm
- Griffin
Media
- The Olympian, founded in 1889, is the newspaper of record for Thurston County.[17]
- The Weekly Volcano has covered Thurston County entertainment since 2001.
Communities
Cities
Towns
Census-designated places
Unincorporated communities
- Boston Harbor
- Driftwood
- East Olympia
- Gate
- Indian Summer
- Kellys Corner
- Lake Lawrence
- Littlerock
- Maytown
- Mushroom Corner
- Offutt Lake
- Saint Clair
- Schneiders Prairie
- South Bay
- Steamboat Island
- Union Mill
- Vail
Ghost towns
Politics
| Year | Republican | Democratic | Third parties |
|---|---|---|---|
| 2016 | 36.2% 48,624 | 51.3% 68,798 | 12.5% 16,769 |
| 2012 | 38.6% 49,287 | 58.0% 74,037 | 3.5% 4,416 |
| 2008 | 38.0% 48,366 | 59.6% 75,882 | 2.5% 3,142 |
| 2004 | 42.6% 47,992 | 55.6% 62,650 | 1.9% 2,147 |
| 2000 | 41.0% 39,924 | 51.8% 50,467 | 7.2% 7,031 |
| 1996 | 34.2% 29,835 | 52.2% 45,522 | 13.7% 11,923 |
| 1992 | 30.3% 25,643 | 45.3% 38,293 | 24.4% 20,633 |
| 1988 | 47.8% 31,980 | 50.6% 33,860 | 1.6% 1,090 |
| 1984 | 55.5% 34,442 | 43.3% 26,840 | 1.2% 763 |
| 1980 | 48.1% 26,369 | 37.4% 20,508 | 14.5% 7,946 |
| 1976 | 47.7% 21,000 | 48.2% 21,247 | 4.1% 1,809 |
| 1972 | 57.5% 22,297 | 37.6% 14,596 | 4.9% 1,899 |
| 1968 | 45.1% 13,742 | 46.7% 14,228 | 8.3% 2,529 |
| 1964 | 34.6% 9,351 | 65.1% 17,578 | 0.3% 92 |
| 1960 | 54.4% 13,921 | 45.4% 11,620 | 0.3% 65 |
| 1956 | 58.7% 14,093 | 41.2% 9,897 | 0.1% 19 |
| 1952 | 58.3% 13,904 | 41.0% 9,764 | 0.7% 172 |
| 1948 | 45.7% 9,511 | 50.3% 10,461 | 4.0% 832 |
| 1944 | 44.5% 7,900 | 54.6% 9,708 | 0.9% 158 |
| 1940 | 39.2% 7,275 | 59.7% 11,092 | 1.1% 206 |
| 1936 | 28.1% 4,425 | 67.5% 10,647 | 4.5% 703 |
| 1932 | 30.9% 4,241 | 46.0% 6,308 | 23.1% 3,173 |
| 1928 | 69.6% 7,203 | 29.1% 3,013 | 1.3% 135 |
| 1924 | 57.8% 5,125 | 10.6% 943 | 31.6% 2,803 |
| 1920 | 52.8% 3,899 | 18.5% 1,367 | 28.7% 2,122 |
| 1916 | 47.8% 3,223 | 39.4% 2,658 | 12.9% 867 |
| 1912 | 30.7% 1,937 | 23.1% 1,456 | 46.2% 2,918[19] |
| 1908 | 57.3% 1,940 | 28.5% 964 | 14.3% 483 |
| 1904 | 68.5% 2,121 | 21.6% 668 | 9.9% 307 |
| 1900 | 54.6% 1,298 | 41.1% 978 | 4.3% 103 |
| 1896 | 42.3% 1,052 | 56.9% 1,415 | 0.9% 22 |
| 1892 | 41.7% 1,043 | 32.4% 810 | 25.9% 648 |
See also
References
- 1 2 "State & County QuickFacts". United States Census Bureau. Retrieved January 8, 2014.
- ↑ "Find a County". National Association of Counties. Retrieved 2011-06-07.
- ↑ Reinartz, Kay. "History of King County Government 1853–2002" (PDF). Archived from the original (PDF) on 2007-12-01. Retrieved 2007-12-29.
- ↑ "Milestones for Washington State History — Part 2: 1851 to 1900". HistoryLink.org. March 6, 2003.
- ↑ "Thurston County Place Names: A Heritage Guide" (PDF). Thurston County Historical Commission. 1992. p. 87. Retrieved 28 March 2018.
- ↑ "2010 Census Gazetteer Files". United States Census Bureau. August 22, 2012. Retrieved July 16, 2015.
- ↑ "Population and Housing Unit Estimates". Retrieved Apr 4, 2018.
- ↑ "U.S. Decennial Census". United States Census Bureau. Retrieved January 8, 2014.
- ↑ "Historical Census Browser". University of Virginia Library. Retrieved January 8, 2014.
- ↑ "Population of Counties by Decennial Census: 1900 to 1990". United States Census Bureau. Retrieved January 8, 2014.
- ↑ "Census 2000 PHC-T-4. Ranking Tables for Counties: 1990 and 2000" (PDF). United States Census Bureau. Retrieved January 8, 2014.
- ↑ "American FactFinder". United States Census Bureau. Retrieved 2011-05-14.
- 1 2 3 "DP-1 Profile of General Population and Housing Characteristics: 2010 Demographic Profile Data". United States Census Bureau. Retrieved 2016-03-06.
- ↑ "Population, Housing Units, Area, and Density: 2010 – County". United States Census Bureau. Retrieved 2016-03-06.
- ↑ "DP02 SELECTED SOCIAL CHARACTERISTICS IN THE UNITED STATES – 2006–2010 American Community Survey 5-Year Estimates". United States Census Bureau. Retrieved 2016-03-06.
- ↑ "DP03 SELECTED ECONOMIC CHARACTERISTICS – 2006–2010 American Community Survey 5-Year Estimates". United States Census Bureau. Retrieved 2016-03-06.
- ↑ Newspapers: The Olympian, McClatchy Company, archived from the original on 2013-03-07, retrieved 2013-02-13
- ↑ Leip, David. "Dave Leip's Atlas of U.S. Presidential Elections". uselectionatlas.org. Retrieved 2018-04-10.
- ↑ The leading "other" candidate, Progressive Theodore Roosevelt, received 1,471 votes, while Socialist candidate Eugene Debs received 1,160 votes, Prohibition candidate Eugene Chafin received 270 votes, and Socialist Labor candidate Arthur Reimer received 17 votes.
External links
- Thurston County, official county site
- Thurton County Chamber of Commerce
- Thurston County Transmission
- OlympiaCommunitySchool.org – Independent K-3 Education
- Thurston Conservation District – Local Solutions to Local Problems
- Thurston County Solid Waste – Waste prevention tips to become more green
- Olympia-Lacey-Tumwater Visitor & Convention Bureau
Places adjacent to Thurston County, Washington | ||||||||||
|---|---|---|---|---|---|---|---|---|---|---|
| ||||||||||
Municipalities and communities of Thurston County, Washington, United States | ||
|---|---|---|
| Cities | | |
| Town | ||
| CDPs | ||
| Unincorporated communities | ||
| Indian reservation | ||
| Ghost town | ||
| Footnotes | ‡This populated place also has portions in an adjacent county or counties | |