Quay County, New Mexico
| Quay County, New Mexico | |
|---|---|
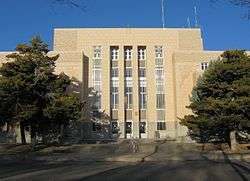 Quay County Courthouse in Tucumcari | |
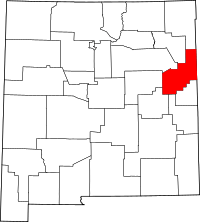 Location in the U.S. state of New Mexico | |
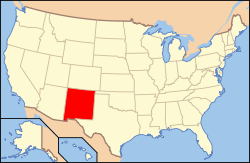 New Mexico's location in the U.S. | |
| Founded | February 28, 1903[1] |
| Named for | Matthew Quay |
| Seat | Tucumcari |
| Largest city | Tucumcari |
| Area | |
| • Total | 2,882 sq mi (7,464 km2) |
| • Land | 2,874 sq mi (7,444 km2) |
| • Water | 7.2 sq mi (19 km2), 0.3% |
| Population (est.) | |
| • (2016) | 8,365 |
| • Density | 3.1/sq mi (1.2/km2) |
| Congressional district | 3rd |
| Time zones | Mountain: UTC−7/−6 |
|
Central: UTC−6/−5 Nara Visa (unofficially) | |
| Website |
quaycounty-nm |
Quay County (pronounced "kway") is a county in the state of New Mexico. As of the 2010 census, the population was 9,041.[2] Its county seat is Tucumcari.[3] The county was named for Pennsylvania senator Matthew Quay, who supported statehood for New Mexico.[4] It is west from the Texas state line.
Geography
According to the U.S. Census Bureau, the county has a total area of 2,882 square miles (7,460 km2), of which 2,874 square miles (7,440 km2) is land and 7.2 square miles (19 km2) (0.3%) is water.[5]
Adjacent counties
- Union County - north
- Harding County - northwest
- San Miguel County - west
- Guadalupe County - west
- De Baca County - southwest
- Roosevelt County - south
- Curry County - south
- Deaf Smith County, Texas - southeast
- Oldham County, Texas - east
- Hartley County, Texas - northeast
Demographics
| Historical population | |||
|---|---|---|---|
| Census | Pop. | %± | |
| 1910 | 14,912 | — | |
| 1920 | 10,444 | −30.0% | |
| 1930 | 10,828 | 3.7% | |
| 1940 | 12,111 | 11.8% | |
| 1950 | 13,971 | 15.4% | |
| 1960 | 12,279 | −12.1% | |
| 1970 | 10,903 | −11.2% | |
| 1980 | 10,577 | −3.0% | |
| 1990 | 10,823 | 2.3% | |
| 2000 | 10,155 | −6.2% | |
| 2010 | 9,041 | −11.0% | |
| Est. 2016 | 8,365 | [6] | −7.5% |
| U.S. Decennial Census[7] 1790-1960[8] 1900-1990[9] 1990-2000[10] 2010-2016[2] | |||
2000 census
As of the 2000 census[11], there were 10,155 people, 4,201 households, and 2,844 families residing in the county. The population density was 4 people per square mile (1/km²). There were 5,664 housing units at an average density of 2 per square mile (1/km²). The racial makeup of the county was 82.09% White, 0.84% Black or African American, 1.27% Native American, 0.80% Asian, 0.15% Pacific Islander, 12.11% from other races, and 2.75% from two or more races. 37.98% of the population were Hispanic or Latino of any race.
There were 4,201 households out of which 28.90% had children under the age of 18 living with them, 52.10% were married couples living together, 12.00% had a female householder with no husband present, and 32.30% were non-families. 28.90% of all households were made up of individuals and 13.80% had someone living alone who was 65 years of age or older. The average household size was 2.37 and the average family size was 2.90.
In the county, the population was spread out with 25.00% under the age of 18, 6.70% from 18 to 24, 23.30% from 25 to 44, 26.00% from 45 to 64, and 19.00% who were 65 years of age or older. The median age was 42 years. For every 100 females there were 94.00 males. For every 100 females age 18 and over, there were 91.50 males.
The median income for a household in the county was $24,894, and the median income for a family was $30,362. Males had a median income of $24,801 versus $17,500 for females. The per capita income for the county was $14,938. About 15.70% of families and 20.90% of the population were below the poverty line, including 25.50% of those under age 18 and 15.80% of those age 65 or over.
2010 census
As of the 2010 census, there were 9,041 people, 4,072 households, and 2,502 families residing in the county.[12] The population density was 3.1 inhabitants per square mile (1.2/km2). There were 5,569 housing units at an average density of 1.9 per square mile (0.73/km2).[13] The racial makeup of the county was 86.1% white, 1.2% American Indian, 1.1% black or African American, 1.0% Asian, 7.2% from other races, and 3.4% from two or more races. Those of Hispanic or Latino origin made up 42.4% of the population.[12] In terms of ancestry, 11.4% were American, 10.7% were English, 10.5% were German, and 9.8% were Irish.[14]
Of the 4,072 households, 26.4% had children under the age of 18 living with them, 43.5% were married couples living together, 12.7% had a female householder with no husband present, 38.6% were non-families, and 34.2% of all households were made up of individuals. The average household size was 2.21 and the average family size was 2.79. The median age was 45.6 years.[12]
The median income for a household in the county was $28,773 and the median income for a family was $41,766. Males had a median income of $29,769 versus $32,462 for females. The per capita income for the county was $18,234. About 13.3% of families and 21.1% of the population were below the poverty line, including 30.7% of those under age 18 and 17.3% of those age 65 or over.[15]
Communities
City
- Tucumcari (county seat)
Villages
Census-designated place
Other communities
Politics
| Year | Republican | Democratic | Third parties |
|---|---|---|---|
| 2016 | 61.9% 2,212 | 28.5% 1,017 | 9.6% 343 |
| 2012 | 59.4% 2,202 | 37.3% 1,383 | 3.3% 122 |
| 2008 | 59.2% 2,367 | 38.7% 1,547 | 2.1% 82 |
| 2004 | 64.6% 2,661 | 34.5% 1,422 | 0.8% 34 |
| 2000 | 59.6% 2,292 | 38.3% 1,471 | 2.1% 81 |
| 1996 | 46.5% 1,943 | 43.8% 1,830 | 9.7% 403 |
| 1992 | 41.0% 1,759 | 41.0% 1,758 | 18.0% 772 |
| 1988 | 55.6% 2,454 | 43.1% 1,901 | 1.3% 57 |
| 1984 | 66.8% 2,842 | 32.2% 1,368 | 1.0% 43 |
| 1980 | 62.1% 2,499 | 35.3% 1,422 | 2.6% 104 |
| 1976 | 49.1% 2,059 | 49.9% 2,095 | 1.0% 41 |
| 1972 | 71.3% 3,224 | 25.7% 1,161 | 3.0% 137 |
| 1968 | 51.4% 2,123 | 33.9% 1,399 | 14.8% 610 |
| 1964 | 47.9% 2,161 | 51.7% 2,333 | 0.5% 21 |
| 1960 | 56.4% 2,652 | 43.6% 2,050 | 0.0% 2 |
| 1956 | 53.5% 2,311 | 46.0% 1,988 | 0.4% 19 |
| 1952 | 53.0% 2,711 | 46.4% 2,375 | 0.6% 29 |
| 1948 | 31.0% 1,392 | 68.2% 3,063 | 0.9% 38 |
| 1944 | 38.8% 1,449 | 60.9% 2,272 | 0.3% 11 |
| 1940 | 30.4% 1,413 | 69.1% 3,215 | 0.5% 22 |
| 1936 | 19.0% 816 | 79.8% 3,423 | 1.2% 51 |
| 1932 | 20.9% 852 | 75.0% 3,058 | 4.1% 167 |
| 1928 | 50.3% 1,616 | 49.6% 1,594 | 0.2% 5 |
| 1924 | 27.8% 851 | 50.6% 1,548 | 21.5% 658 |
| 1920 | 39.2% 1,213 | 58.5% 1,813 | 2.3% 72 |
| 1916 | 25.0% 598 | 64.2% 1,539 | 10.9% 260 |
| 1912 | 18.7% 351 | 47.1% 884 | 34.2% 643 |
See also
References
- ↑ "Quay - County". quaycounty-nm.gov. Retrieved April 1, 2018.
- 1 2 "State & County QuickFacts". United States Census Bureau. Retrieved September 30, 2013.
- ↑ "Find a County". National Association of Counties. Archived from the original on May 31, 2011. Retrieved June 7, 2011.
- ↑ Westergaard, Waldemar (1919). "Senator Bard and the Arizona-New Mexico Statehood Controversy". Annual Publication of the Historical Society of Southern California. 11 (2): 11. JSTOR 41168767.
- ↑ "2010 Census Gazetteer Files". United States Census Bureau. August 22, 2012. Archived from the original on January 1, 2015. Retrieved January 2, 2015.
- ↑ "Population and Housing Unit Estimates". Retrieved June 9, 2017.
- ↑ "U.S. Decennial Census". United States Census Bureau. Archived from the original on May 12, 2015. Retrieved January 2, 2015.
- ↑ "Historical Census Browser". University of Virginia Library. Retrieved January 2, 2015.
- ↑ "Population of Counties by Decennial Census: 1900 to 1990". United States Census Bureau. Retrieved January 2, 2015.
- ↑ "Census 2000 PHC-T-4. Ranking Tables for Counties: 1990 and 2000" (PDF). United States Census Bureau. Retrieved January 2, 2015.
- ↑ "American FactFinder". United States Census Bureau. Archived from the original on September 11, 2013. Retrieved January 31, 2008.
- 1 2 3 "DP-1 Profile of General Population and Housing Characteristics: 2010 Demographic Profile Data". United States Census Bureau. Retrieved 2016-01-24.
- ↑ "Population, Housing Units, Area, and Density: 2010 - County". United States Census Bureau. Retrieved 2016-01-24.
- ↑ "DP02 SELECTED SOCIAL CHARACTERISTICS IN THE UNITED STATES – 2006-2010 American Community Survey 5-Year Estimates". United States Census Bureau. Retrieved 2016-01-24.
- ↑ "DP03 SELECTED ECONOMIC CHARACTERISTICS – 2006-2010 American Community Survey 5-Year Estimates". United States Census Bureau. Retrieved 2016-01-24.
- ↑ Leip, David. "Dave Leip's Atlas of U.S. Presidential Elections". uselectionatlas.org. Retrieved 2018-04-01.
Places adjacent to Quay County, New Mexico | |
|---|---|
Municipalities and communities of Quay County, New Mexico, United States | ||
|---|---|---|
| City | | |
| Villages | ||
| CDP | ||
| Other unincorporated communities | ||
| Footnotes | ‡This populated place also extends into Texas | |
Santa Fe (capital) | ||
| Topics |
| |
| Society | ||
| Regions |
| |
| Cities | ||
| Counties | ||