Saint-Claude-de-Diray
| Saint-Claude-de-Diray | ||
|---|---|---|
| Commune | ||
_Mairie-%C3%A9coles.JPG) Town hall and school | ||
| ||
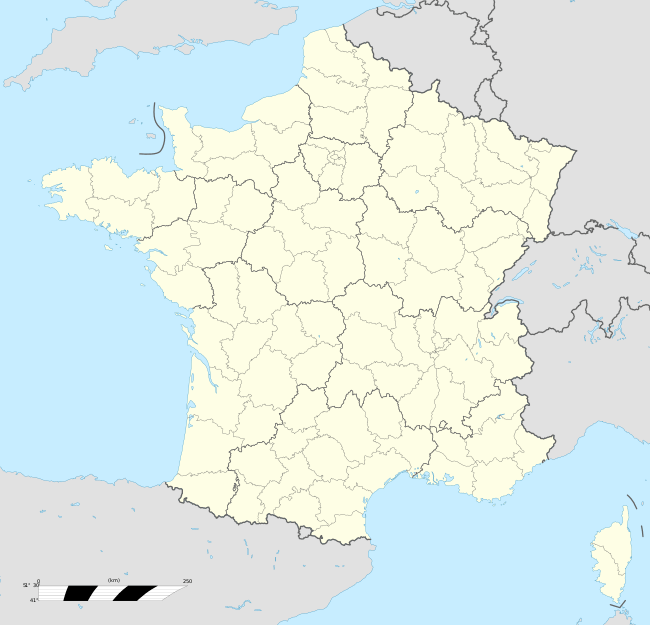 Saint-Claude-de-Diray Location within Centre-Val de Loire region 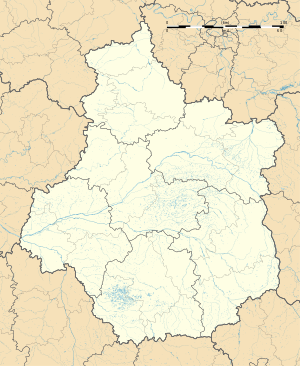 Saint-Claude-de-Diray | ||
| Coordinates: 47°36′56″N 1°25′00″E / 47.6156°N 1.4167°ECoordinates: 47°36′56″N 1°25′00″E / 47.6156°N 1.4167°E | ||
| Country | France | |
| Region | Centre-Val de Loire | |
| Department | Loir-et-Cher | |
| Arrondissement | Blois | |
| Canton | Chambord | |
| Intercommunality | Pays de Chambord | |
| Government | ||
| • Mayor (2014–2020) | Laurent Allanic | |
| Area1 | 9.17 km2 (3.54 sq mi) | |
| Population (2015)2 | 1,762 | |
| • Density | 190/km2 (500/sq mi) | |
| Time zone | UTC+1 (CET) | |
| • Summer (DST) | UTC+2 (CEST) | |
| INSEE/Postal code | 41204 /41350 | |
| Elevation |
67–94 m (220–308 ft) (avg. 84 m or 276 ft) | |
|
1 French Land Register data, which excludes lakes, ponds, glaciers > 1 km2 (0.386 sq mi or 247 acres) and river estuaries. 2 Population without double counting: residents of multiple communes (e.g., students and military personnel) only counted once. | ||
.svg.png)
Saint-Claude-de-Diray is a commune in the Loir-et-Cher department of central France.
Population
| Historical population | ||
|---|---|---|
| Year | Pop. | ±% |
| 1793 | 1,363 | — |
| 1806 | 1,319 | −3.2% |
| 1821 | 1,530 | +16.0% |
| 1831 | 1,515 | −1.0% |
| 1841 | 1,463 | −3.4% |
| 1851 | 1,390 | −5.0% |
| 1861 | 1,356 | −2.4% |
| 1872 | 1,234 | −9.0% |
| 1881 | 1,166 | −5.5% |
| 1891 | 1,138 | −2.4% |
| 1901 | 1,067 | −6.2% |
| 1911 | 1,014 | −5.0% |
| 1921 | 915 | −9.8% |
| 1931 | 959 | +4.8% |
| 1946 | 919 | −4.2% |
| 1954 | 959 | +4.4% |
| 1962 | 991 | +3.3% |
| 1968 | 976 | −1.5% |
| 1975 | 1,019 | +4.4% |
| 1982 | 1,251 | +22.8% |
| 1990 | 1,435 | +14.7% |
| 1999 | 1,562 | +8.9% |
| 2006 | 1,653 | +5.8% |
| 2015 | 1,762 | +6.6% |
See also
References
| Wikimedia Commons has media related to Saint-Claude-de-Diray. |
This article is issued from
Wikipedia.
The text is licensed under Creative Commons - Attribution - Sharealike.
Additional terms may apply for the media files.