Solar power in California
Solar power in California has been growing rapidly because of high insolation, community support, declining solar costs, and a Renewable Portfolio Standard which requires that 33% of California's electricity come from renewable resources by 2020, and 50% by 2030.[1] Much of this is expected to come from solar power via photovoltaic facilities or solar thermal power facilities.
In 2016, California reported a total of 19,783 GWh in solar electricity generation, approximately 9.97% of all electricity produced. This represented 35.8% of the state's non-hydro renewable energy generation.[2]
At the end of 2016, California had a total installed solar capacity of 18,919.8 MW, making it the highest solar power generating state in the nation.[3] In April, 2017, this capacity generated 5,045 GWh, or 13.78% of the total electricity generated that month[4] SEIA currently estimates that California's solar capacity powers 4,885,000 homes in the state, and employs 100,050. It is estimated that the state will add an additional 13,670 MW of capacity over a period between 2017 and 2021. As part of California's legislative and regulatory strategy there will be an additional 300 MW of solar power for disadvantaged and low income communities. A legislative bill, AB 693 (2015 Eggman), provided for the low income solar Multifamily Affordable Solar Housing Rooftops (MAHSR) program to be implemented by program administrators in recognition that disadvantaged and low income customers should experience the benefits of solar, despite the potential lack of community resources. The bill recognized not only environmental justice, but income status. Expectation is that the program will be approved by the California Public Utilities Commission (CPUC) and implemented by existing Multifamily Affordable Solar Housing (MASH) program administrators who asked to implement the program using California greenhouse gas auction funds beginning in the fourth quarter 2017.
On May 13, 2017, the California Independent System Operator (CAISO) reported that the state had broken a new renewable energy record, with non-hydro renewables providing 67.2% of the total electricity on the ISO's grid, with another 13.5% being provided by hydro. The ISO reported that solar was providing approximately 17.2% of the total electricity.
On March 5, 2018, at around 1 PM, utility grade solar energy met 50% of California's total electrical power demand for the first time.[5]
History
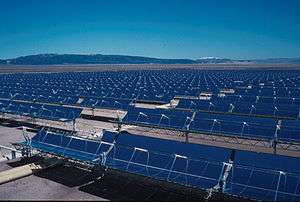
Over the last 20 years, California has been home to a number of "world's largest" solar facilities, many of which are located in the Mojave Desert. In 1991, the 354 MW Solar Energy Generating Systems plant (located in San Bernardino County, California) held the title until being bested by the 392 MW Ivanpah Solar Electric Generating System, a solar thermal plant located in San Bernardino County near the Nevada border.
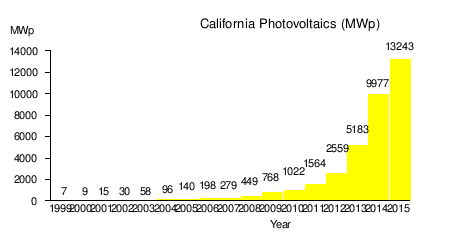
The early to mid 2010s saw the sharpest increase in solar development.[6] By the end of 2013, California had 490 MW of concentrated solar power and 5,183 MW of photovoltaics capacity in operation.[7]
In 2014, the 550 MW Topaz Solar Farm became the new "world's largest operational" solar facility went online in San Luis Obispo County, California. A second 550 MW facility, Desert Sunlight Solar Farm, also went online in Riverside County in 2014 and was constructed by First Solar. Both these were superseded, however, by the Solar Star photovoltaic project that went online with 579 MW in June 2015 in Antelope Valley, California, which is located in southern Kern County.[8] While California hosted the three largest photovoltaic facilities in the world (as of July 2015), there are yet several proposals for even larger facilities seeking regulatory approval in California, such as the 2.7 GW Westlands Solar Park.
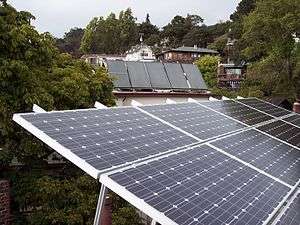
In December 2017, the Solar on Multifamily Affordable Housing (SOMAH) program was approved by the California Public Utilities Commission. The program will allocate one billion dollars over the following decade to make solar accessible for California residents living in affordable housing.[9] California also leads the nation in the number of homes which have solar panels installed, totaling over 230,000.[10] Many were installed because of the Million Solar Roof Initiative.[11]
In May 2018, the 5 commissioners of the California Energy Commission (CEC) voted unanimously to require that nearly all new homes in the state be built with solar panels.[12] Starting in January 2020, all new homes under 4 stories will have photovoltaic solar panels installed. The size of the systems to be installed is to be somewhat limited and is intended to perform a supplementary role. Builders will be able to decrease the size of the system further if they incorporate power storage into the home. The justification for the smaller size of the systems is due to the high amount of clean energy in the grid during the day, much of which is attributable to California's extensive use of utility grade solar systems. This overlap would devalue a full system, as the energy being displaced from the gird is already green.[13]
Housing affordability is also a concern with this measure. The requirement of photovoltaic panels on new homes is expected to make them less affordable, an area where California already struggles greatly - with the only state less affordable being Hawaii.[14] The CEC released data showing that the system would more than pay for itself, however charitable organizations such as Habitat for Humanity have expressed their concerns as this will require the organization to receive additional donations in order to pay for the photovoltaic panels that the group would be required to install on every house it builds.[15]
Photovoltaics
In 2011, California's goal to install 3,000 MW of distributed generation by 2016 was expanded to 12,000 MW by 2020.[16] California has more photovoltaics installed than any other federal state, and 48% of the U.S. total in 2010. For the first time in 2008 the installed photovoltaics exceeded the state's 354 MW of solar thermal (CSP).[17][18][19] There are plans to build over 15,000 MW of utility scale photovoltaic plants in California.[20] At the end of 2012, small systems of less than 10 kWp were averaging $5.39/W, and large systems of over 500 kWp were averaging $2.77/W.[21]
California has the technical potential to install 128.9 GW of rooftop solar panels, which would generate 194,000 GWh/year, about 74% of the total electricity used in California in 2013. This is environmentally favorable, as less desert would have to be requisitioned for solar projects as it could be built atop preexisting structures instead. 128 GW, though, is three to four times as much electricity as is used, which requires that most of the noon output will need to be stored or exported on a sunny day.[22]
 |
|
Planned
- The Crimson Solar Project is a proposed 350 MW photovoltaic power station to be located southwest of Mesa Verde, California and will include an energy storage project.[24][25]
Under construction
- The Blythe Solar Power Project is a partially completed 485 MW photovoltaic power station which is located in eastern Riverside County.
- The California Flats Solar Project is a planned 280 MW photovoltaic power station to be located in Monterey County.[26]
- The San Pablo Raceway Solar Plant is a 100 MW photovoltaic facility located in Los Angeles County that is in the beginning stages of construction.[27]
Operational
- The Desert Sunlight Solar Farm is a 550 MW solar power plant in Riverside County, that uses thin-film solar CdTe-modules made by First Solar. The plant was completed in December 2014.[28]
- The Imperial Valley Solar Project is a 99 MW power station, located in Imperial County.
- The California Valley Solar Ranch (CVSR) is a 250 MW solar photovoltaic power plant, built by SunPower in the Carrizo Plain, northeast of California Valley.[29]
- The Mount Signal Solar project was completed near the Mexican border in May 2014. The installed PV capacity of the solar farm amounts to 265.7 MW (206 MWAC).[30][31][32]
- The Topaz Solar Farm is a 550 MW power station located in San Luis Obispo County. It was completed in November 2014 and was the world's largest PV power plant at the time.
- The Desert Stateline Solar Facility is a 300 MW power plant near the Nevada border in San Bernardino County.
- The Redwood Solar Facility is a cluster of 4 smaller solar generating stations that amount to 100 MW. It is located in Kern County with the final phase being completed in March 2018.[33][34]
Solar thermal power

California has several large concentrated solar power plants.
The Ivanpah Solar Electric Generating System (392 MW), located 40 miles (60 km) southwest of Las Vegas and developed by BrightSource Energy and Bechtel, is the world's largest solar thermal power project.[35][36] The project has received a $1.375 billion loan guarantee from the United States Department of Energy. It deploys 347,000 heliostat mirrors focusing solar energy on boilers located on centralized solar power towers.[35]
The Genesis Solar Energy Project is an operational 250 MW solar thermal power station located in Riverside County, California. It features a parabolic trough design and is run by NextEra Energy Resources.[37]
Operational
- The Solar Energy Generating Systems, is a 361 MW (was 394 MW until 2014) parabolic trough concentrated solar power station located in the Mojave Desert completed in 1990.
- The Genesis Solar Energy Project, is a 280 MW parabolic trough concentrated solar power station located in the Mojave Desert completed in 2013.
- The Ivanpah Solar Power Facility, is a 392 MW solar power tower concentrated solar power station located in the Mojave Desert completed in 2014.
- The Mojave Solar Project, is a 280 MW parabolic trough concentrated solar power station located in the Mojave Desert completed in 2014.
Total operational installed gross power is 1,313 MW (1346 MW until 2014). Production in 2015 was 2,309 GWh, 71.2% of U.S. total solar thermal generation.[38]
Planned
South Belridge Oil Field, near Bakersfield, California, a solar EOR facility that is projected to eliminate 376,000 metric tons of carbon emissions. It was announced in November 2017 as a joint venture between GlassPoint Solar and Aera Energy.[39]
In 2012, the Bureau of Land Management gave priority status to 5 solar project proposals in California.[30] The 750 MW McCoy Solar Energy Project was proposed by NextEra, though only 1/3 of that wattage was ever installed. The remaining development of the project is currently on hold. The 100 MW Desert Harvest project has been proposed by enXco. The 664 MW Calico Solar Energy Project was redesigned by K Power but later abandoned.[40]
Generation
Utility-scale California solar electric generation according to the Energy Information Administration (EIA)[41][42] [43]
| Year | Generation (GWh) |
Generation (% of CA total) |
Generation (% of USA Solar) |
|---|---|---|---|
| 2010 | 769 | 0.4% | 63.5% |
| 2011 | 889 | 0.4% | 48.2% |
| 2012 | 1,382 | 0.7% | 31.9% |
| 2013 | 3,814 | 1.9% | 42.8% |
| 2014 | 9,932 | 5.0% | 54.0% |
| 2015 | 14,814 | 7.53% | 59.5% |
| 2016 | 18,807 | 9.5% | 52.2% |
| 2017* | 23,100 | 11.2% | 43.6% |
(*) Preliminary data from Electric Power Monthly.
Beginning with the 2014 data year, Energy Information Administration has estimated distributed solar photovoltaic generation and distributed solar photovoltaic capacity. These non-utility scale estimates project that, California, generated the following additional solar energy.
| Year | Summer Capacity (MW) |
Electric energy (GWh) |
|---|---|---|
| 2014 | 2350 | 3,862 |
| 2015 | 3391.4 | 6,014 |
| 2016 | 5257.9 | 8,230 |
| 2017 | 6604.6 | 10,633 |
Government support
Renewable Portfolio Standard
Solar power in California has been growing rapidly, because of a Renewable Portfolio Standard which requires that 20% of California's electricity come from renewable resources by 2010, and 33% by 2020. Much of this is expected to come from solar power.
According to a recent report by the California Public Utilities Commission, California failed to meet the 20% renewables by 2010 target. Pacific Gas & Electric and Southern California Edison were the closest to meeting the goal. PG&E generated 17.7% of the electricity it sold in 2010 from renewable sources while SCE was the closest to hitting the RPS goal by producing 19.4% of its electricity from renewable sources in 2010. San Diego Gas & Electric, on the other hand, generated only 11.9% of its electricity from renewable sources in 2010.[47]
As of July 2014, California had 7,808 MW[48] of solar and 5,830 MW[49] of wind farms. California adopted feed-in tariffs, a tool similar to what Europe has been using, to encourage the solar power industry. Proposals were raised aiming to create a small-scale solar market in California that brings the benefits of the German market, such as distributed generation, which avoids the need for transmission because power is generated close to where it is used, and avoid the drawbacks such as excessively high payments that could become a burden on utility customers.[50]
California Solar Initiative
The California Solar Initiative is a 2006 initiative to install 3,000 MW of additional solar power by 2016. Included in it is the Million Solar Roof Initiative.[51] In 2011, this goal was expanded to 12,000 MW by 2020.[52] As part of Governor Arnold Schwarzenegger's Million Solar Roofs Program, California has set a goal to create 1,940 megawatts[53] of new, solar-produced electricity by 2016 — moving the state toward a cleaner energy future and helping lower the cost of solar systems for consumers. The California Solar Initiative has "a total budget of $2.167 billion between 2007 and 2016 and a goal to install approximately 1,940 MW of new solar generation capacity." [54] Many of the homes, schools and businesses which have installed solar panels can be monitored online on the Internet.[55][56]
According to the CPUC, homeowners, businesses, and local governments installed 158 MW of solar photovoltaics (PV) in 2008, doubling the 78 MW installed in 2007, giving California a cumulative total of 441 MW of distributed solar PV systems, the highest in the country.[57] As of August 2016, 4,216 MW have been installed in 537,647 projects. The average cost of systems less than 10 kW is $5.33/watt and $4.38/watt for systems over 10 kW.[58] Of these, 3,391 MW were rooftop solar in 2015.[59]
The CSI initially offered cash incentives on solar PV systems of up to $2.50 per AC watt. These incentives, combined with federal tax incentives, could cover up to 50% of the total cost of a solar system. The incentive program was designed so that the incentives would reduce in steps based on the amount of solar installed in each of 6 categories. There are separate steps for residential and non-residential customers in the territories of each of the State's 3 investor-owned utilities. As of July 2012, the rebates range from $0.20 to $0.35 per AC watt for residential and commercial systems and from $0.70 to $1.10 for systems for non-profits and government entities.[54]
There are many financial incentives to support the use of renewable energy in other US states.[60] CSI provides more than $2 billion worth of incentives to customers for installing photovoltaic,[61] and electricity displacing solar thermal[62] systems in the three California Investor-Owned Utilities service territories.
The program was authorized by the California Public Utilities Commission and by the Senate Bill 1 (SB 1):
- Decision (D.) 06-01-024, in collaboration with the California Energy Commission, with the goal of installing 3,000 MW of new solar facilities in California's homes and businesses by 2017.
- On August 21, 2006, the Governor signed SB1, which directs the CPUC and the CEC to implement the CSI program consistent with specific requirements and budget limits set forth in legislation.
Responsibility for administration of the CSI Program is shared by Investor-Owned Utilities:
- Pacific Gas and Electric Company – PG&E customers;
- Southern California Edison Company – SCE customers;
- California Center for Sustainable Energy – SDG&E customers.
Residential installation starts in early 2007 fell off sharply in SCE territory because of the disincentives inherent in SB1, requiring time-of-use (TOU) tariffs, with the result that homeowners who install panels may find their electric bill increasing rather than decreasing. The governor and legislature moved quickly to pass AB1714 (June 2007) to delay the implementation of this rule until 2009.
Net metering
California has a favorable net metering law, being one of five states to receive an A in 2007, while five states received an F, in an evaluation of the 38 states plus Washington D.C. with net metering.[63] IREC best practices, based on experience, recommends no limits to net metering, individual or aggregate, and perpetual roll over of kWh credits.[64] As California was rapidly approaching the 5% aggregate limit, a May 24, 2012 ruling by the CPUC clarified the calculation of the limit, and requested a report on the cost of net metering.[65][66] California subsequently uncapped the net metering program.[67] Typically states have raised or eliminated their aggregate limits before they were reached.[68] By 2011, 16 states including California received an A for net metering.[69]
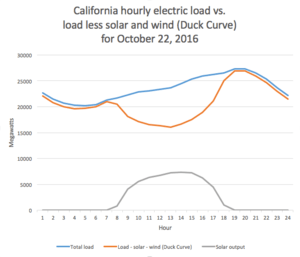
The California solar deployment has increased its duck curve (power demand for traditional power plants) to the point where large power plants are turned down to minimum during the day, while requiring large and fast power ramping by load following and peaker plants to supply peak demand in the evening when the sun has gone down. Several methods are being developed to cope with the change.[70] Time-of-use pricing is being rolled out, and has been effective in Hawaii.[71]
Mandatory solar power in new homes
In March 2008, Culver City established the first in the nation mandatory solar photovoltaic requirement, which requires an installation of 1 KW of solar photovoltaic power per 10,000 sq ft of new or major remodeled commercial building area.[72]
In March 2013, Lancaster, California became the first U.S. city to mandate the inclusion of solar panels on new homes, requiring that "every new housing development must average 1 kilowatt per house."[73] In May 2013, Sebastopol followed suit, requiring new buildings include either 2 W/sq ft (21.7 W/m2) of insulated building space of photovoltaics, or enough to provide 75% of the expected annual electricity use.[74]
Since January 1, 2014 California law requires all new buildings less than ten stories tall be "solar ready".[75]
In April 2016, San Francisco mandated that all new buildings less than ten stories tall include solar panels or solar water heating covering at least 15% of the roof, beginning January 1, 2017.[76]
Streamlined permitting
California governor Jerry Brown signed a streamlined permitting bill (AB 2188) for residential solar systems on September 22, 2014. AB 2188 has four major provisions designed to reduce red-tape associated with local solar permits and requires that, by the end of September 2015, all California cities and counties must "adopt an ordinance that creates an expedited, streamlined permitting process for residential rooftop solar energy systems of less than 10 kilowatts in size."[77] Research and industry reports project the bill could reduce the cost of installing a typical residential solar system in the state by over $1,000.[78]
Alameda County solar financing
Using a 20-year property assessment known as PACE financing, the city of Berkeley had a successful pilot program from 2008 to 2009 as the first city in the country to allow residents to obtain solar power without any initial payment. In the plan, property owners paid as much in increased property taxes as they save in energy costs, allowing them to install the panels for free at no cost to the city. Thirty eight projects are being installed for the pilot stage of the program.[79] PACE financing has spread to 28 states, but is on hold in many due to objections by Freddie Mac and Fannie Mae, including in Berkeley (which has not continued the pilot as a result). Legislation has been introduced to require acceptance of PACE financing.[80]
City of Los Angeles feed-in tariff
The City of Los Angeles Department of Water and Power initiated a program on January 11, 2013 to pay up to 17 cents/kWh for electricity generated by up to 100 MW of solar power in a feed-in tariff program. 20 MW is reserved for small projects of less than 150 kW each. The program could be expanded to 150 MW in March.[81][82]
| Year | Available |
|---|---|
| 2013 | 40 MW |
| 2014 | 40 MW |
| 2015 | 20 MW |
| Tier | Available | Small systems | Feed in tariff |
|---|---|---|---|
| 1 | 10 MW | 2 MW | 17 cents/kWh |
| 2 | 25 MW | 5 MW | 16 cents/kWh |
| 3 | 50 MW | 10 MW | 15 cents/kWh |
| 4 | 75 MW | 15 MW | 14 cents/kWh |
| 5 | 100 MW | 20 MW | 13 cents/kWh |
State challenges with solar power
California has invested extremely heavily in solar energy, and energy storage is becoming a more prominent issue. This is because solar is a more periodically available power source than natural gas and coal; photovoltaic solar panels can only operate during daylight hours and thermal solar installations cannot operate at peak efficiency throughout the entire night, thus there is a window in which a large portion of the state's energy production must be picked up by other types of utilities. To remedy this, different sorts of power storage solutions have been proposed such as conventional batteries along with more heavily investing in thermal solar plants which are capable of storing heat from the day for energy production at night.[83]
In April 2018, The San Diego Union Tribune reported that Recurrent Energy (a subsidiary of Canadian Solar) had proposed the world's largest battery, a 350 MW system, be installed alongside the proposed Crimson Solar Project. The battery will match the proposed facility's nameplate capacity, and is several times larger than the largest battery in existence, which was created by Tesla and is located in Australia.[84]
Another issue is overproduction which is most common during the summer months. California's solar production was so vast that by 2017, California had to pay Arizona and other states in the region to accept some of its electricity during peak production hours in order to provide relief to its grid.[85]
California also has aggressive goals when it comes to zero emissions vehicles (ZEVs), and the most prominent type is the electric car, which relies on grid power to charge its battery. Plug-in hybrid cars are also very popular in the state. These types of vehicles add to the demand and burden placed on the electrical grid, which was not designed to support the larger electrical loads required by electric vehicles.[86] One potential solution is to bypass most of the grid with the installation of rooftop solar panels for daytime charging and making use of home energy storage at night. Some electric companies will also provide discounted rates for car owners who charge their vehicles at night when demand is lower. Some cars can be programmed to stagger their charging cycle thought the night. This leads to a steady rate of charging instead of a large spike in the early evening when most commuters return home.[87]
Public opinion
The majority of Californians in desert country support large-scale solar development, according to a 2012 survey conducted on behalf of BrightSource Energy. The survey of more than 1,000 people was conducted throughout Imperial, Inyo, Kern, Riverside, San Bernardino counties in California, where many utility-scale solar projects are underway or planned. Survey results showed that nearly four out of five (almost 80 percent) of people strongly supported development of solar power in their communities. The survey also found that the majority of people were concerned with climate change. It also found that two-thirds of respondents think renewable energy is important to California's future and that the state and federal government should help provide incentives for renewable energy projects.[88]
See also
References
- ↑ "California: Renewables Portfolio Standard". Database of State Incentives for Renewables & Efficiency. 2015-10-07. Retrieved 2015-11-01.
- ↑ "California Energy Commission, Total System Electric Generation 2016". energy.ca.gov. June 23, 2017.
- ↑ "California Solar". seia.org.
- ↑ "Energy Information Administration, Electric Power Monthly". eia.gov. June 23, 2017. Archived from the original on 2011-10-05.
- ↑ Coren, Michael (9 March 2018). "California is taking a cooling off period after generating too much energy from the sun". Quartz. Retrieved 12 March 2018.
- ↑ "California Energy Commission – Tracking Progress" (PDF). Retrieved 2018-03-19.
- ↑ Sherwood, Larry (July 2014). "U.S. Solar Market Trends 2013" (PDF). Interstate Renewable Energy Council (IREC). Retrieved 2014-07-21.
- ↑ Wesoff, Eric (26 June 2015). "Solar Star, Largest PV Power Plant in the World, Now Operational". Greentech Media. Retrieved 28 July 2015.
- ↑ Cohen, Josh (8 January 2018). "California Will Spend $1 Billion on Low-income, Multifamily Solar". Next City. Retrieved 12 March 2018.
- ↑ Evan Halper (2014-08-09). "Rules prevent solar panels in many states with abundant sunlight". Los Angeles Times. Retrieved 2014-08-30.
- ↑ Million Solar Roofs Initiative
- ↑ Oliver, Kevin (9 May 2018). "Regulator OKs solar panel mandate for new California homes". News KCRA, Sacramento-Stockton-Modesto. Retrieved 9 May 2018.
- ↑ Collins, Jeff (4 May 2018). "California to become first U.S. state mandating solar on new homes". The Orange County Registrar. Retrieved 9 May 2018.
- ↑ US News Staff (27 February 2018). "Best States 2018: How They Were Ranked". US News. Archived from the original on 2017-03-02. Retrieved 9 May 2018.
- ↑ Chen, Angela (9 May 2018). "California is requiring solar panels on all new houses: here's what that means". The Verge. Retrieved 9 May 2018.
- ↑ 12,000 MW of Renewable Distributed Generation by 2020
- ↑ California Solar Photovoltaic Statistics & Data retrieved 01 March 2009
- ↑ Solar Market Trends
- ↑ (DAV-SEAC), NREL Data Analysis and Visualization Group. "The Open PV Project - Search". openpv.nrel.gov. Retrieved 2018-05-01.
- ↑ Major Projects List
- ↑ "California Solar Statistics". www.californiasolarstatistics.ca.gov. Retrieved 2018-05-01.
- ↑ Rooftop Solar Photovoltaic Technical Potential in the United States: A Detailed Assessment
- ↑ "PV Watts". NREL. Retrieved 11 June 2012.
- ↑ "BLM SCHEDULES PUBLIC SCOPING MEETING ON CRIMSON SOLAR PROJECT". Bureau of Land Management. Retrieved 19 April 2018.
- ↑ "Crimson Solar Project: More Public Meetings Discovered". Basin and Range Watch. Retrieved 19 April 2018.
- ↑ "404". www.firstsolar.com. Retrieved 2018-05-01.
- ↑ Weaver, John (11 June 2018). "sPower secures 100 MW solar power PPA with California aggregator". PV Magazine. Retrieved 11 June 2018.
- ↑ "First Solar completes another half-gigawatt project in California". 15 January 2015.
- ↑ "NRG Energy, NRG Yield and SunPower Begin Commercial Operations at 250 MW California Valley Solar Ranch". Retrieved 2018-05-01.
- 1 2 Bureau of Land Management (November 22, 2011). "2012 Renewable Energy Priority Projects". Archived from the original on January 28, 2012.
- ↑ Mount Signal Solar Is Online: World's Largest Single Axis Solar PV Project, SustainableBusiness.com, 05/23/2014
- ↑ 206MW Mt. Signal Solar Farm Completed, Energy Matters, May 22, 2014
- ↑ "8minutenergy Celebrates Completion of 26 Megawatt Redwood 4 Solar Farm | 8minutenergy". 8minutenergy. 2018-03-07. Retrieved 2018-03-08.
- ↑ "Redwood 4 blooms in California". reNEWS - Renewable Energy News. 2018-03-07. Retrieved 2018-03-08.
- 1 2 Todd Woody. In California’s Mojave Desert, Solar-Thermal Projects Take Off Archived 2010-11-05 at the Wayback Machine. Yale Environment 360, 27 October 2010.
- ↑ "Solar energy plant in California gets new partner in NRG". Power Engineering International. PennWell Corporation. 2010-10-28. Retrieved 2010-10-29.
- ↑ Another Huge Solar Plant Goes Online in California's Desert Archived 2016-05-15 at the Portuguese Web Archive, Chris Clarke, REWIRE, May 5, 2014
- ↑ "Electric Power Monthly with Data for December 2015" (PDF). U.S. Energy Information Administration. February 2016. Retrieved 2015-03-09.
- ↑ "GlassPoint Announces Belridge Solar Project".
- ↑ K Road Gives Up on Calico Solar Project, RenewableEnergyWorld.com, James Montgomery, July 01, 2013
- ↑ "Electric Power Annual" retrieved 2017 6 17
- ↑ "Electric Power monthly"browser retrieved 2018 7 26
- ↑ "Electric Power monthly" retrieved 2017 9 6
- ↑ "Electric Power Monthly" |title=Electric Power Monthly (February 2017 with data for December 2016) - Table 1.17.B. Net Generation from Solar Photovoltaic retrieved 2017 6 19
- ↑ "Electric Power Monthly" |title=Electric Power Monthly (February 2018 with data for December 2017) - Table 1.17.B. Net Generation from Solar Photovoltaic retrieved 2018 5 29
- ↑ "Electric Power Monthly" |title=Electric Power Monthly (February 2018 with data for December 2017) - Table 6.2.B. Net Capacity from Solar Photovoltaic retrieved 2018 7 27
- ↑ California Utilities Do Not Meet 2010 Renewable Energy Goal
- ↑ "California Solar". Retrieved 2014-11-02.
- ↑ "U.S. Wind Industry Report". American Wind Energy Association. 2014. Retrieved 2014-11-03.
- ↑ "California Eyes Euro-Style Market For Solar". Dow Jones Newswires. October 6, 2009. Archived from the original on October 10, 2009.
- ↑ The California Solar Initiative Archived 2009-02-23 at the Wayback Machine.
- ↑ Seba, Tony. "The eBay of Electricity". Forbes. Retrieved 2018-05-01.
- ↑ About the California Solar Initiative Archived 2013-03-07 at the Wayback Machine..
- 1 2 The California Solar Initiative.
- ↑ "PV Ladder". www.pvoutput.org. Retrieved 2018-05-01.
- ↑ "Enphase installation map". enlighten.enphaseenergy.com. Retrieved 2018-05-01.
- ↑ CPUC Press Release
- ↑ California Solar Statistics Archive list
- ↑ 2016 State of the Interconnection page 10-14 + 18-23. WECC, 2016. Archive
- ↑ Financial Incentives in the USA Archived 2008-01-09 at the Wayback Machine..
- ↑ CSI Handbook
- ↑ California Public Utilities Commission press release "CPUC establishes California Solar Initiative requirements for solar thermal technologies", December 20, 2007. Accessed February 15, 2008.
- ↑ Report: States Falling Short on Interconnection and Net Metering Archived 2008-05-15 at the Wayback Machine.
- ↑ Net Metering and Interconnection Procedures Incorporating Best Practices
- ↑ "Freeing the Grid". freeingthegrid.org. Retrieved 2018-04-13.
- ↑ Decision Regarding Calculation of the Net Energy Metering Cap
- ↑ "Solar homeowners win big in California ruling, for now". San Francisco Chronicle. Retrieved 2018-04-13.
- ↑ 2011 Updates and Trends
- ↑ "Freeing the Grid". freeingthegrid.org. Retrieved 2018-04-13.
- ↑ Wirfs-Brock, Jordan (2014-10-02). "IE Questions: Why Is California Trying To Behead The Duck?". Inside Energy. Retrieved 2016-10-29.
- ↑ Lazar, Jim (8 August 2016). "The Duck is learning to fly in California and Hawaii". Utility Dive. Retrieved 29 October 2016.
- ↑ "Culver City Building Safety Division Mandatory Solar Photovoltaic Requirement". culvercity.org (official website). City of Culver City. Retrieved 22 March 2018.
- ↑ "Lancaster, CA, Becomes First US City to Require Solar". Greentech Media. March 27, 2013.
- ↑ "California town of Sebastopol will require solar panels on all new homes". Grist. 2013-05-09. Retrieved 2018-04-13.
- ↑ "California poised to require 'solar ready roofs' on new homes and buildings". The Mercury News. 2012-05-30. Retrieved 2018-04-13.
- ↑ Pentland, William. "San Francisco Becomes First Major U.S. City To Mandate Rooftop Solar In New Buildings". Forbes. Retrieved 2018-04-13.
- ↑ Eric Wesoff (2014-09-22). "New California Law Cuts Solar-Permitting Red Tape". GreenTech Media. Retrieved 2014-09-23.
- ↑ Chad Garland (2014-08-23). "Assembly bill could lower cost of residential solar in California". The Los Angeles Times. Retrieved 2014-09-23.
- ↑ Berkeley FIRST Archived 2013-06-02 at the Wayback Machine. retrieved 4 February 2009
- ↑ Property Assessed Clean Energy Financing (PACE)
- ↑ "Los Angeles DWP unveils solar power buyback program". LA Times Blogs - L.A. NOW. 2013-01-11. Retrieved 2018-04-13.
- ↑ "Feed-in Tariff (FiT) Program". www.ladwp.com. Retrieved 2018-04-13.
- ↑ Brady, Jeff (April 5, 2016). "Solar And Wind Energy May Be Nice, But How Can We Store It?". NPR. Retrieved March 22, 2018.
- ↑ Roth, Sammy (12 April 2018). "World's biggest battery could power up in California". The San Diego Union Tribune.
- ↑ "California's Solar Energy Overload". Institute for Energy Research. Retrieved 11 April 2018.
- ↑ Sperling, Daniel (1 October 2013). "Plug-in vehicles generate new variables for power grids". Institute of Electrical and Electronics Engineers. Retrieved 13 April 2018.
- ↑ Bullis, Kevin (16 August 2013). "Could Electric Cars Threaten the Grid?". MIT Technology Review. Retrieved 13 April 2018.
- ↑ Chris Meehan (Feb 20, 2012). "New survey finds most in California desert support solar". Clean Energy Authority.
External links
| Wikimedia Commons has media related to Solar power in California. |
- Go Solar California
- California Energy Commission
- California Solar Energy Industries Association
- Northern California Solar Energy Association
- Solar California
- Renewables Portfolio Standard
- California's Renewable Energy Law Lives!
- Clean Power Estimator (California only)
- California daily hourly power production
- Google Map of Operating and Under Construction California Utility Scale PV
- NREL solar insolation map
Sacramento (capital) | ||
| Topics |  | |
| Regions |
| |
| Metro regions | ||
| Counties |
| |
| Most populous cities | ||