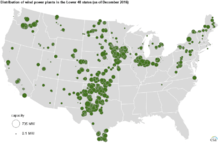
Wind power in the United States

Wind power in the United States is a branch of the energy industry that has expanded quickly over the latest several years.[1] For the twelve months through November 2017, 254.2 terawatt-hours were generated by wind power, or 6.33% of all generated electrical energy.[2]
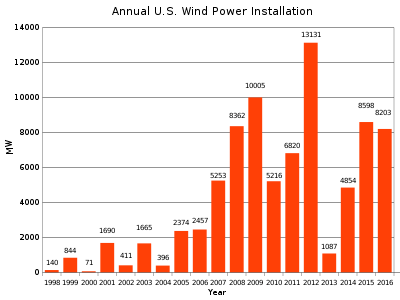
As of January 2017, the total installed wind power nameplate generating capacity in the United States was 82,183 megawatts (MW).[3] This capacity is exceeded only by China and the European Union.[4] Thus far, wind power's largest growth in capacity was in 2012, when 11,895 MW of wind power was installed, representing 26.5% of new power capacity.[1]
In 2016, Nebraska became the eighteenth state to have installed over 1,000 MW of wind power capacity.[3] Texas, with over 20,000 MW of capacity, had the most installed wind power capacity of any U.S. state at the end of 2016. Texas also had more under construction than any other state currently has installed.[3] The state generating the highest percentage of energy from wind power is Iowa,[5] while North Dakota has the most per capita wind generation.
The Alta Wind Energy Center in California is the largest wind farm in the United States with a capacity of 1,548 MW.[6] GE Power is the largest domestic wind turbine manufacturer.[7]
History
The first municipal use of multiple wind-electric turbines in the USA may have been a five turbine system in Pettibone, North Dakota in 1940. These were commercial Wincharger units on guyed towers.[8]
In 1980 the world's first wind farm, consisting of twenty 30 kW wind turbines was installed at Crotched Mountain, in New Hampshire.[9]
From 1974 through the mid-1980s the United States government worked with industry to advance the technology and enable large commercial wind turbines. A series of NASA wind turbines were developed under a program to create a utility-scale wind turbine industry in the U.S., with funding from the National Science Foundation and later the United States Department of Energy (DOE). A total of 13 experimental wind turbines were put into operation, in four major wind turbine designs. This research and development program pioneered many of the multi-megawatt turbine technologies in use today, including: steel tube towers, variable-speed generators, composite blade materials, partial-span pitch control, as well as aerodynamic, structural, and acoustic engineering design capabilities.
Later, in the 1980s, California provided tax rebates for wind power. These rebates funded the first major use of wind power for utility electric power. These machines, gathered in large wind parks such as at Altamont Pass would be considered small and un-economic by modern wind power development standards. In 1985 half of the world's wind energy was generated at Altamont Pass. By the end of 1986 about 6,700 wind turbines, mostly less than 100 kW, had been installed at Altamont, at a cost of about $1 billion, and generated about 550 million kWh/year.[10]
Largest wind farms
Ten of the largest wind farms in the United States are:
| Project | Capacity (MW) | State |
|---|---|---|
| Alta Wind Energy Center | 1548[6] | California |
| Shepherds Flat Wind Farm | 845[11] | Oregon |
| Roscoe Wind Farm | 781[12] | Texas |
| Horse Hollow Wind Energy Center | 736 | Texas |
| Tehachapi Pass Wind Farm | 705 | California |
| Capricorn Ridge Wind Farm | 662 | Texas |
| San Gorgonio Pass Wind Farm | 619 | California |
| Fowler Ridge Wind Farm | 600 | Indiana |
| Sweetwater Wind Farm | 585[13] | Texas |
| Altamont Pass Wind Farm | 576[14] | California |
Economics
A 2012 report by a clean energy consulting group concluded that new wind farms can produce electric power in the 5-8 cents per kWh range, making wind power cost-competitive with fossil fuels in many areas.[15] As of 2013, the US Energy Information Administration estimates the "levelized cost" of wind energy from new installations as 7 to 10 cents per kWh, depending on the geographic area, but cautioned that levelized costs of non-dispatchable sources such as wind should be compared to the avoided energy cost rather than the levelized cost of dispatchable sources such as natural gas, or baseload sources such as coal or geothermal.[16] In 2015, a Koch-funded institute[17][18][19] of Utah State University stated that the cost of wind energy is higher than most cost estimates calculate. Renewable portfolio standards require renewable energy to exist (most of them intermittent such as wind and solar), but at the expense of utilities and consumers. The production tax credit makes wind power cheaper for utilities and consumers, but at the expense of taxpayers.[20] The American Wind Energy Association has criticized the study of lacking comparison with pollution and subsidies incurred by other electric power sources, and for counting transmission as a cost rather than a benefit.[21]
National trends
Production
 |
| Wind power generated since 2000 (GWh)[22][23] |
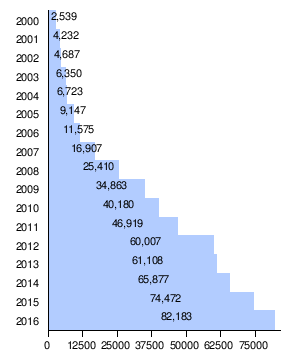 |
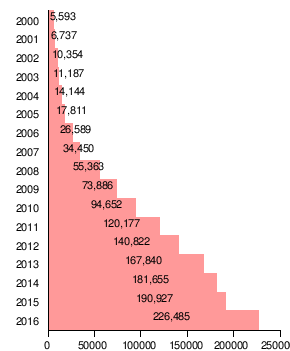
| Installed wind power generating capacity since 2000 (MW)[24][25][26][3] |
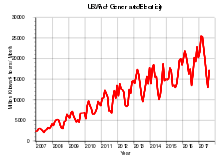
As of 2017, the United States has over 82 GW of installed wind power capacity.[3] Wind power has increased dramatically over the past years. In 2010, however, newly installed generating capacity was about half of the previous year due to various factors, including the financial crisis, and recession. In 2013 there was a 92% reduction in newly installed generating capacity compared to 2012, due to the late extension of the PTC (see image on the right).[27] The graph at left shows the growth in installed wind generation capacity in the United States based on data from the Office of Energy Efficiency and Renewable Energy.[25] In 2008, installed capacity in the U.S. increased by 50% over the prior year. The world average growth rate that year was 28.8%.[28]
By 2014, the wind industry in the USA was able to produce more power at lower cost by using taller wind turbines with longer blades, capturing the faster winds at higher elevations. This opened up new opportunities and in Indiana, Michigan, and Ohio, the price of power from wind turbines built 300 feet to 400 feet above the ground competed with conventional fossil fuels like coal. Prices had fallen to about 4 cents per kilowatt-hour in some cases and utilities had been increasing the amount of wind energy in their portfolio, saying it is their cheapest option.[29] For power contracts made in the year 2014, the average price of wind power fell to 2.5¢/kWh.[30]
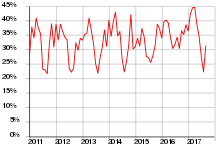
The capacity factor is the ratio of power actually produced divided by the nameplate capacity of the turbines. The overall average capacity factor for wind generation in the US increased from 31.7% in 2008, to 32.3% in 2013.[31]
Wind generation potential
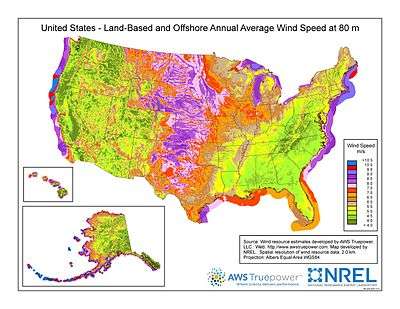
According to the National Renewable Energy Laboratory, the contiguous United States has the potential for 10,459 GW of onshore wind power.[32][33] The capacity could generate 37 petawatt-hours (PW·h) annually, an amount nine times larger than current total U.S. electricity consumption.[34] The U.S. also has large wind resources in Alaska,[35] and Hawaii.[36]
In addition to the large onshore wind resources, the U.S. has large offshore wind power potential,[37] with another NREL report released in September 2010 showing that the U.S. has 4,150 GW of potential offshore wind power nameplate capacity, an amount 4 times that of the country's 2008 installed capacity from all sources, of 1,010 GW.[38]
The U.S. Department of Energy’s 2008 report 20% Wind Energy by 2030[39] envisioned that wind power could supply 20% of all U.S. electric power, which included a contribution of 4% to the nation’s total electric power from offshore wind power.[40] In order to achieve this, however, significant advances in cost, performance and reliability are needed, based on a 2011 report from a coalition of researchers from universities, industry, and government, supported by the Atkinson Center for a Sustainable Future.[41] Obtaining 20% from wind requires about 305 GW of wind turbines, an increase of 16 GW/year after 2018, or an average increase of 14.6%/year, and transmission line improvements.[39] Analysts estimate around 25 GW of added US wind power in 2016-18,[42] depending on the Clean Power Plan and PTC extensions. After the current PTC phase-out in 2021, additional wind power capacity is expected to be around 5 GW per year.[43]
Wind power by state
In 2015, electric power generation from wind power was 10 percent or more in twelve U.S. states: Colorado, Idaho, Iowa, Kansas, Maine, Minnesota, North Dakota, Oklahoma, Oregon, and South Dakota, Vermont, and Texas. Iowa, South Dakota, and Kansas each had more than 20 percent of their electric power generation come from wind.[44] Twenty states now have more than five percent of their generation coming from wind.[44]
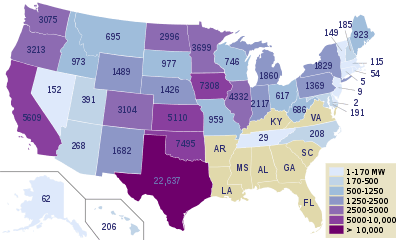
The five states with the most wind capacity installed at the start of 2017 were:[3]
- Texas (20,321 MW)
- Iowa (6,917 MW)
- Oklahoma (6,645 MW)
- California (5,662 MW)
- Kansas (4,451 MW)
Fourteen states now have 10 percent or more of their generation coming from wind power. Most of these are in the central plains. These states include North Dakota, South Dakota, Minnesota, Iowa, Nebraska, Colorado, Kansas, Oklahoma, New Mexico, Texas, Maine, Vermont, Oregon, and Idaho.[5]
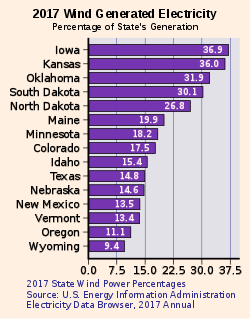
The top five states according to percentage of generation by wind in 2016 were:[5]
- Iowa (36.6%)
- South Dakota (30.3%)
- Kansas (29.6%)
- Oklahoma (25.1%)
- North Dakota (21.5%)
Texas
In 2016 Texas surpassed the 20,000 MW mark by adding over 1800 MW of generating capacity.[3] In 2011, Texas had become the first state to surpass the 10,000 MW mark. [45]
In July 2008, Texas approved a $4.93 billion expansion of the state's electric grid to bring wind energy to its major cities from western areas of the state. Transmission companies will recoup the cost of constructing the new power lines, expected to be completed in 2013, from fees estimated at $4 per month for residential customers.[46] A lack of transmission capacity forced wind turbines to be shut down at times and reduced wind power generation in Texas by 17% in 2009.[47]
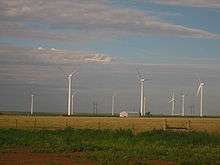
The Roscoe Wind Farm in Roscoe, Texas, Texas's largest wind farm with 627 wind turbines and a total installed capacity of 781.5 MW, surpassed the nearby 735.5 MW Horse Hollow Wind Energy Center. It is located about 200 miles (320 km) west of Fort Worth and the wind farm area spans parts of four Texas counties.[48][49]
| Wind farm | Installed capacity (MW) | Turbine manufacturer | County |
|---|---|---|---|
| Buffalo Gap Wind Farm | 523 | Vestas | Taylor / Nolan |
| Capricorn Ridge Wind Farm | 662 | GE Energy / Siemens | Sterling / Coke |
| Horse Hollow Wind Energy Center | 735 | GE Energy / Siemens | Taylor / Nolan |
| Lone Star Wind Farm | 400 | Gamesa | Shackelford / Callahan |
| Panther Creek Wind Farm | 458 | GE Energy | Howard / … |
| Papalote Creek Wind Farm | 380[53] | Siemens | San Patricio |
| Peñascal Wind Farm | 404 | Mitsubishi | Kenedy |
| Roscoe Wind Farm | 781[54] | Mitsubishi | Nolan |
| Sweetwater Wind Farm | 585 | GE Energy / Siemens / Mitsubishi | Nolan |
California
Wind power in California has doubled in capacity since 2002. With a total of nearly 4,000 megawatts installed, as of the end of 2011, wind energy now supplies about 5% of California’s total electric power needs, or enough to power more than 400,000 households. The amount varies greatly from day to day.[55] In 2011, 921.3 megawatts were installed. Most of that activity occurred in the Tehachapi area of Kern County, with some big projects in Solano, Contra Costa and Riverside counties as well. After 2014, California ranked second nationwide in terms of capacity, behind Texas with a capacity of 5,917 MW.[1]
Large portions of California's wind output, are located in three primary regions: Altamont Pass Wind Farm (east of San Francisco); Tehachapi Pass Wind Farm (south east of Bakersfield), and San Gorgonio Pass Wind Farm (near Palm Springs, east of Los Angeles). The giant new Alta Wind Energy Center, is also located within the Tehachapi Pass region.[56]
| Name | Location | Capacity (MW) | Ref |
|---|---|---|---|
| Altamont Pass Wind Farm | Alameda County | 576 | [57] |
| Alta Wind Energy Center | Kern County | 1548 | [6] |
| San Gorgonio Pass Wind Farm | Riverside County | 615 | [57] |
| Tehachapi Pass Wind Farm | Kern County | 705 | [57] |

Iowa
More than 35 percent of the electric power generated in Iowa now comes from wind power.[5] Iowa had over 6900 megawatts (MW) of generation capacity at the end of 2016.[5] Electrical energy generated in Iowa by wind in 2014 amounted to over 16 million Megawatt-hours.[23] Since Iowa adopted a renewable energy standard in 1983, the wind power industry has generated over $10 billion in investment.[58] The second concrete wind turbine tower to be built in the U.S., and also the country's tallest (377 feet) at the time built, is in Adams county. The tower was completed in the spring of 2016.[59]
In 2018, it was announced that a company called Invenergy would develop a pair of wind farms in Iowa. Each farm would be capable of generating 200 MW. Construction is planned to begin in early 2019. In 2017, the U.S. Energy Information Administration said wind provided 37% of Iowa's power generation.[60]
Oklahoma
Oklahoma has one of the best resources in the United States. Bergey Windpower, a leading manufacturer of small wind turbines is located in Oklahoma. Programs leading to careers in the wind power industry are provided at tech schools, community colleges and universities in Oklahoma. The Oklahoma Wind Power Initiative supports the development of wind power in the state.[61]
Illinois

Wind power has been supported by a renewable portfolio standard,[62] passed in 2007, and strengthened in 2009, which requires 10% renewable energy from electric companies by 2010 and 25% by 2025. Illinois has the potential for installing up to an estimated 249,882 MW of wind generation capacity at a hub height of 80 meters.[63]
Kansas
In 2012, Kansas saw a large number of wind projects completed making it among the largest and fastest growing wind energy markets. At the end of 2014 the total capacity sits at 2,967 MW.[1][64] Kansas has high potential capacity for wind power, second behind Texas. The most recent estimates are that Kansas has a potential for 950 GW of wind power capacity. Kansas could generate 3,900 TW·h of electric power each year, which represents more than all the electric power generated from coal, natural gas and nuclear combined in the United States in 2011.[65]
Commercialization of wind power
Industry trends
Since 2005 many turbine manufacturing leaders have opened U.S. facilities; of the top 10 global manufacturers in 2007, seven – Vestas, GE Energy, Gamesa, Suzlon, Siemens, Acciona, and Nordex – have an American manufacturing presence.[67][68][30] REpower is another manufacturer with notable usage in the United States.[69]
Plans for 30 new manufacturing facilities were announced in 2008, and the wind industry expects to see a continued shift towards domestic manufacturing in the coming years. In total, 70 manufacturing facilities have begun production, been expanded, or announced since January 2007.[67]
As of April 2009, over 100 companies are producing components for wind turbines, employing thousands of workers in the manufacture of parts as varied as towers, composite blades, bearings and gears. Many existing companies in traditional manufacturing states have retooled to enter the wind industry. Their manufacturing facilities are spread across 40 states, employing workers from the Southeast to the Steel Belt, to the Great Plains and on to the Pacific Northwest.[67]
The U.S. Department of Energy (DOE) is working with six leading wind turbine manufacturers towards achieving 20% wind power in the United States by 2030. The DOE announced the Memorandum of Understanding (MOU) with GE Energy, Siemens Power Generation, Vestas Wind Systems, Clipper Windpower, Suzlon Energy, and Gamesa Corporation. Under the MOU, the DOE and the six manufacturers will collaborate to gather and exchange information relating to five major areas: research and development related to turbine reliability and operability; siting strategies for wind power facilities; standards development for turbine certification and universal interconnection of wind turbines; manufacturing advances in design, process automation, and fabrication techniques; and workforce development.[39][70]
In 2014, GE had 60%, Siemens had 26%, and Vestas had 12% of US market share. Combined, they had 98%.[71] Most new turbines were designed for low wind. The turbine manufacturers compete with each other and cause decreasing turbine prices.[30]
Other government involvement
The DOE's National Renewable Energy Laboratory (NREL) has announced a number of wind technology projects, including a new state-of-the-art wind turbine blade test facility to be built in Ingleside, Texas. The Texas-NREL Large Blade Research and Test Facility will be capable of testing blades as long as 70 meters (230 feet). It will be built and operated through a partnership among NREL, DOE, and a state consortium led by University of Houston, with the university owning and operating the facility's buildings, DOE funding up to $2 million in capital costs, and NREL providing technical and operational assistance. The blade test facility is estimated to cost between $12 million and $15 million and should be completed by 2010. Located on the Gulf Coast, the Texas facility will complement a similar facility that is being built on the coast of Massachusetts.[72]
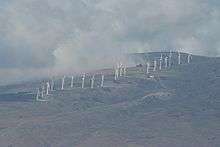
NREL has also recently signed agreements with Siemens Power Generation and First Wind, a wind power developer. Siemens is launching a new research and development facility in nearby Boulder, Colorado, and has agreed to locate and test a commercial-scale wind turbine at NREL's National Wind Technology Center (NWTC). First Wind (formerly called UPC Wind Partners, LLC) owns and operates the 30-megawatt Kaheawa Wind Power farm in West Maui, Hawaii, and has agreed to let the NWTC establish a Remote Research Affiliate Partner Site at the facility. The Maui satellite of NWTC will collaborate with First Wind on studies to develop advanced wind energy technologies, including energy storage and integration of renewable electric power into Maui's electrical grid.[73]
In 2010, the DOE awarded $60 million for a study of transmission requirements.[74] Beginning in 2006, the DOE is required to provide a transmission congestion report once every three years.[75]
Recent U.S. policy has generally been to provide an inflation-adjusted federal production tax credit (PTC) of $15 per MW·h (in 1995 dollars) generated for the first ten years of operation for wind energy sold. As of 2015, the credit was $23 per MW·h.[76] Renewable portfolio standards mandating a certain percentage of electric power sales come from renewable energy sources, which are in place in about half of the states, also have boosted the development of the wind industry.[77]
Each time Congress has allowed the production tax credit to expire, wind power development has slowed as investors wait for the credit to be restored. Each year it is renewed, development has expanded. The tax credit expired at the end of 2012, bringing wind power development activity to a near halt. A short term, one year policy was enacted at the beginning of 2013 which provides a tax credit to projects under construction by the end of 2013 and completed before the end of 2014.[78] The PTC was first introduced in 1992.[79] When it was allowed to expire, development dropped 93%, 73%, and 77% the following year.
The Energy Information Administration has reported that wind power received the largest share of direct federal subsidies and support in fiscal year 2013 (the latest year for which statistics are available), accounting for 37% ($5.936 billion) of total electric power related subsidies. Almost three-quarters of wind energy subsidies in that year were direct expenditures and largely resulted from the ARRA programs. These figures do not include subsidies and supports from other levels of government.[80]
The development of wind power in the United States has been supported primarily through a production tax credit (PTC), which pays producers on the amount of electric power produced. On January 1, 2013 the production tax credit was extended for another year.[78]
In late 2015 authorities provided an extension of the Production Tax Credit. The extension phases out the credit over a period of five years. The 30 percent wind and solar tax credit will extend through 2019 and then taper to 10 percent in 2022.[81]
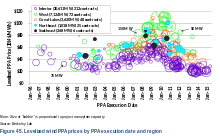
The average price of Power purchase agreements was $23.5/MWh in 2014.[71] Operating expenses were estimated to $10/MWh.[30]
Siting considerations
There is competition for wind farms among farmers in places like Iowa or ranchers in Colorado. Farmers, with no investment on their part, typically receive $3,000–5,000 per year in royalties[82] from the local utility for siting a single, large, advanced-design wind turbine.[83][84][85][86][87]
Landscape and ecological issues may be significant for some wind farm proposals,[88] and environmental issues are a consideration in site selection.[89]
Worldwide experience has shown that community consultation and direct involvement of the general public in wind farm projects has helped to increase community approval, and some wind farms overseas have become tourist attractions, like the Ten Mile Lagoon wind farm.
Offshore wind power
Offshore development is hindered by relatively high cost compared to onshore facilities. Several projects are under development with some at advanced stages of development.[90] The United States, though, has very large offshore wind energy resources due to strong, consistent winds off the long U.S. coastline.[40]
The 2011 NREL report, Large-Scale Offshore Wind Power in the United States, analyzes the current state of the offshore wind energy industry. According to the report, offshore wind resource development would help the country to achieve 20% of its electric power from wind by 2030 and to revitalize the manufacturing sector. Offshore wind could supply 54 gigawatts of capacity to the nation's electrical grid, thereby increasing energy security. It could also generate an estimated $200 billion in new economic activity and create thousands of permanent jobs.[91] NREL’s report concludes that "the development of the nation’s offshore wind resources can provide many potential benefits, and that offshore wind energy could play a vital role in future U.S. energy markets".[91]
Coastal residents have opposed offshore wind farms because of fears about impacts on marine life, the environment, electric power rates, aesthetics, and recreation such as fishing and boating. However, residents also cite improved electric power rates, air quality, and job creation as positive impacts they would expect from wind farms.[92][93] Because the bases of offshore turbines function as artificial reefs, studies have shown that after the initial disturbance of construction, local fish and shellfish are positively affected.[92][94] Because wind turbines can be positioned at some distance from shore, impacts to recreation and fishing can be managed by careful planning of wind farm locations.[92]
Five exploratory leases for wind power production on the Outer Continental Shelf offshore from New Jersey and Delaware were issued in June 2009 by the Secretary of the Interior. The leases authorize data gathering activities, allowing for the construction of meteorological towers on the Outer Continental Shelf from six to 18 miles (29 km) offshore.[95] Four areas are being considered.[96] On February 7, 2011, Salazar and Steven Chu announced a national strategy to have offshore wind power of 10 GW in 2020, and 54 GW in 2030.[97]
Projects are under development in areas of the East Coast, Great Lakes, and Gulf coast.[90]
New England
Rhode Island and Massachusetts state officials picked Deepwater Wind to build a $1.5-billion, 385-megawatt wind farm in federal waters off Block Island. The 100-turbine project could provide 1.3 terawatt-hours (TW·h) of electric power per year – 15 percent of all electric power used in the state of Rhode Island.[98][99][100] In 2009, Deepwater signed an agreement with National Grid to sell the power from a $200-million, 30-MW wind farm off Block Island, at an initial price of 24.4 ¢/kW·h.[101] Construction of the Block Island Wind Farm, a five turbine project began in April 2015.
Cape Wind started development around 2002, but faced opposition and eventually ceased before being realized. The floating VolturnUS operated in a Maine river in 2013.
Mid Atlantic
To promote wind power in New Jersey, in 2007 the state awarded a $4.4 million contract to conduct an 18-month Ocean/Wind Power Ecological Baseline Study, becoming the first state to sponsor an ocean and wind power study before allowing renewable energy developers to study and build off its shores. The study focused on a designated area off the coast to determine the current distribution, abundance and migratory patterns of avian species, fish, marine resources and sea turtle use of the existing ecological resources.[102] The results of the study were released in June 2010. The study concluded that the effects of developing offshore windfarms would be negligible.[103][104][105]
In 2008, new federal rules greatly expanded the territory offshore wind parks can be built. Previously, projects were only allowed in shallow state waters within 3 nautical miles (5.6 km) of shore. The edge of U.S. territory is about 200 nautical miles (370 km) out. Increased distance from the coast diminishes their visibility. Waters off the coast of the United States are deeper than in Europe, requiring different designs.[106]
Atlantic Wind Connection is a proposed electrical transmission backbone to be built off the Atlantic Coast of the United States to serve offshore wind farms. The transmission line, proposed by Trans-Elect Development Company, would deliver power ashore in southern Virginia, Delaware, southern New Jersey and northern New Jersey. As a first of its kind project, it poses significant risks of encountering unexpected technological challenges and cost overruns.[107] Such an offshore backbone is an element in the national electric power strategy.[97] Bechtel has been selected as the EPC contractor and Alstom as technical advisor for the first phase of the development for the project.[108] Google and Good Energies, an investment firm, are the major investors in the $5 billion project.[107]
Wind energy meteorology
Winds in the Central plains region of the U.S. are variable on both short (minutes) and long (days) time scales. Variations in wind speed result in variations in power output from wind farms, which poses difficulties incorporating wind power into an integrated power system. Wind turbines are driven by boundary layer winds, those that occur near the surface of the earth, at around 300 feet. Boundary layer winds are controlled by wind in the higher free atmosphere and have turbulence due to interaction with surface features such as trees, hills, and buildings. Short term or high frequency variations are due to this turbulence in the boundary layer.[109]
Long term variations are due to the passage of transient waves in the atmosphere, with a characteristic time scale of several days. The transient waves that influence wind in the Central U.S. are large scale and this results in the power output from wind farms in the region being somewhat correlated and not entirely independent. Large scale distribution of wind farms significantly reduce short term variability, limiting the relative standard deviation of the capacity factor to about 45%.[109] The correlation is highest in summer and lowest in winter.[110]
Environmental Impacts and Regulations
Bird protection
The US federal government has jurisdiction to prevent bird and bat deaths by wind turbines, under the Endangered Species Act, the Migratory Bird Treaty Act, and the Bald and Golden Eagle Protection Act. Under the 2009 Bald and Golden Eagle Protection Act, the Interior Department could issue permits to allow "non-purposeful take" for activities where eagle deaths were considered unavoidable; however, as of December 2013, no take permits had been issued to wind energy developers.[111] The United States Fish and Wildlife Service has published voluntary guidelines for design and siting of wind turbines to minimize bird and bat deaths.[112]
In 2013, the Obama administration was accused of having a double standard to protect the wind industry from Bald and Golden Eagle Protection Act prosecutions, while vigorously pursuing violations by oil companies and owners of power lines. The administration refused to divulge the number of raptor deaths reported to it by wind companies, saying that to do so would reveal trade secrets. The government also ordered federal law enforcement field agents not to pursue bird-death prosecutions against wind companies without prior approval from Washington. The policy was said to be an environmental trade-off to promote renewable energy.[113]
In November 2013, the federal government obtained its first criminal conviction of a wind power operator for killing protected birds in violation of the 1918 Migratory Bird Treaty Act. Duke Energy plead guilty, and was fined $1 million, for the deaths of 160 birds, including 14 golden eagles, at two wind farms in Wyoming. The Justice Department charged that Duke had designed and sited the turbines knowing that they would kill birds; Duke noted that it had self-reported the bird deaths, and that US Fish and Wildlife Service guidelines for reducing bird deaths by wind turbines had not been issued when the turbines were built. After they were charged, Duke implemented a radar detection system, at a cost of $600,000 per year, designed to turn off turbines when approached by large birds; the company noted that the system was working, as no golden eagle deaths had been observed in more than a year of operation since the radar was installed.[114][115]
In December 2013 the US Fish and Wildlife Service announced that it would issue 30-year permits to wind energy projects to allow for eagle deaths; previously, permits had been available for only 5 years, but none were issued to wind projects. Under the 30-year permits, wind power developers would be required to report eagle deaths, and the permits would be reviewed every 5 years. The measure was intended to remove what was seen as legal uncertainty discouraging wind energy investments. The government said that an environmental review was not needed for the change, because it was only an administrative change.[111] The new regulation was welcomed by the American Wind Energy Association, which said that wind power caused less than two percent of human-caused eagle fatalities, and pointed out that the rules would require extensive mitigation and monitoring of eagle deaths.[116] The extension of eagle taking permits from 5 to 30 years was opposed by a number of conservation groups, including the American Bird Conservancy, the Nature Conservancy, the Sierra Club, the Audubon Society, and the Humane Society of the United States.[117][118]
More than 30,000 wind turbine locations are really close to the federally protected bird habitats, out of which almost 24,000 lie in the migratory corridor of the whooping crane and almost 3000 in the breeding grounds of the endangered Greater Sage- Grouse.[119] As per the director of the American Bird Conservancy's Bird Smart Wind Energy Campaign, Dr Michael Hutchins , wind turbines present a real threat to the Nation's birds. He also addressed that how ineffective the present voluntary permitting guidelines and the requirement of mandatory permitting guidelines for the same. Tom Vinson, the American Wind Energy Association vice president for regulatory affairs stated the ambiguity in estimation and extrapolation of various datas and also questioned the credibility of the assumptions of Agencies like ABC while making claims of future bird deaths .[119]
Rising concerns about the bird deaths prompted ABC, in collaboration with 70 other conservation organisations, to lobby the federal Government by Pressurising the U.S. Department of Interior to develop a National Programmatic Wind Environmental Impact Statement which would identify appropriate areas for wind energy development, as well as areas where development should be avoided, but these lobbying efforts failed.[119]
Collision risks are primarily influenced by the height of the turbines and tower type. The average death count of the birds increased as the current turbine heights reached a height of 475 to 639 feet. The danger to the birds increase because the blades now start penetrating the average flight height zone of the Nocturnal Migrating Birds.[120]
Offshore wind
The harassment of any marine mammal species in U.S. waters is a violation of the Marine Mammal Protection Act of 1972 (50 CFR 18). Offshore wind developers are required to apply for a letter of authorization or Incidental Harassment Authorization with all the pertinent details of the species under potential threat from their offshore activities, the mitigation measures, and monitoring and reporting obligations. Offshore wind projects must also comply with all regulatory obligations contained in the Federally approved State coastal management plan, under the Coastal Zone Management Act of 1972, to keep in check their effect on coastal resources.[121]
Statistics
| Year | Total | % of total | Jan | Feb | Mar | Apr | May | Jun | Jul | Aug | Sep | Oct | Nov | Dec |
|---|---|---|---|---|---|---|---|---|---|---|---|---|---|---|
| 1990 | 2,789 | |||||||||||||
| 1991 | 2,951 | |||||||||||||
| 1992 | 2,888 | |||||||||||||
| 1993 | 3,006 | |||||||||||||
| 1994 | 3,447 | |||||||||||||
| 1995 | 3,164 | |||||||||||||
| 1996 | 3,234 | |||||||||||||
| 1997 | 3,288 | |||||||||||||
| 1998 | 3,026 | |||||||||||||
| 1999 | 4,488 | |||||||||||||
| 2000 | 5,593 | |||||||||||||
| 2001 | 6,737 | |||||||||||||
| 2002 | 10,354 | |||||||||||||
| 2003 | 10,729 | |||||||||||||
| 2004 | 14,144 | 0.36% | 999 | 1,022 | 1,291 | 1,295 | 1,702 | 1,397 | 1,164 | 1,051 | 1,090 | 1,029 | 932 | 1,172 |
| 2005 | 14,597 | 0.36% | 899 | 783 | 1,235 | 1,408 | 1,494 | 1,539 | 1,171 | 918 | 1,275 | 1,256 | 1,363 | 1,257 |
| 2006 | 26,589 | 0.65% | 2,383 | 1,922 | 2,359 | 2,472 | 2,459 | 2,052 | 1,955 | 1,655 | 1,879 | 2,442 | 2,540 | 2,472 |
| 2007 | 32,143 | 0.77% | 2,459 | 2,541 | 3,061 | 3,194 | 2,858 | 2,395 | 1,928 | 2,446 | 2,641 | 3,056 | 2,705 | 2,859 |
| 2008 | 55,363 | 1.34% | 4,273 | 3,852 | 4,782 | 5,225 | 5,340 | 5,140 | 4,008 | 3,264 | 3,111 | 4,756 | 4,994 | 6,616 |
| 2009 | 73,886 | 1.87% | 5,951 | 5,852 | 7,099 | 7,458 | 6,262 | 5,599 | 4,955 | 5,464 | 4,651 | 6,814 | 6,875 | 6,906 |
| 2010 | 94,652 | 2.29% | 6,854 | 5,432 | 8,589 | 9,764 | 8,698 | 8,049 | 6,724 | 6,686 | 7,106 | 7,944 | 9,748 | 9,059 |
| 2011 | 120,177 | 2.93% | 8,550 | 10,452 | 10,545 | 12,422 | 11,772 | 10,985 | 7,489 | 7,476 | 6,869 | 10,525 | 12,439 | 10,656 |
| 2012 | 140,822 | 3.48% | 13,632 | 11,052 | 14,026 | 12,709 | 12,541 | 11,972 | 8,822 | 8,469 | 8,790 | 12,636 | 11,649 | 14,524 |
| 2013 | 167,665 | 4.13% | 14,633 | 13,907 | 15,643 | 17,294 | 16,264 | 13,766 | 11,146 | 9,593 | 11,709 | 13,720 | 15,888 | 14,100 |
| 2014 | 181,791 | 4.44% | 17,989 | 14,001 | 17,779 | 18,747 | 15,532 | 15,691 | 12,096 | 10,187 | 11,473 | 14,552 | 18,997 | 14,696 |
| 2015 | 190,927 | 4.67% | 15,258 | 14,964 | 15,361 | 17,835 | 17,060 | 13,398 | 13,632 | 13,040 | 13,859 | 16,391 | 19,693 | 20,067 |
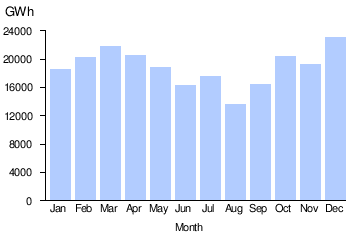
| 2016 | 226,551 | 5.55% | 18,511 | 20,214 | 21,752 | 20,555 | 18,824 | 16,364 | 17,589 | 13,565 | 16,435 | 20,376 | 19,334 | 23,032 |
| 2017 | 254,254 | 6.33% | 20,270 | 21,692 | 25,599 | 25,403 | 22,317 | 19,429 | 15,711 | 13,094 | 17,291 | 24,789 | 23,320 | 22,776 |
| 2018 | 168,514 | 6.96% | 26,834 | 23,936 | 27,275 | 26,757 | 23,405 | 24,411 | 15,897 | |||||
| Last entry, % of Total | 7.19% | 7.81% | 8.53% | 8.85% | 6.90% | 6.57% | 3.87% | 3.44% | 5.17% | 7.76% | 7.60% | 6.58% | ||
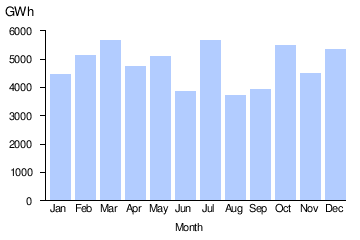
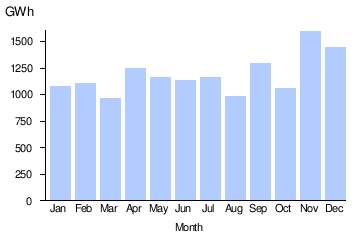
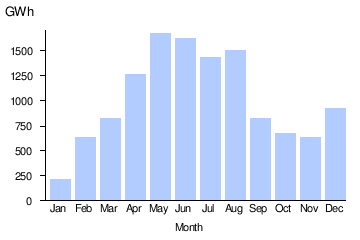
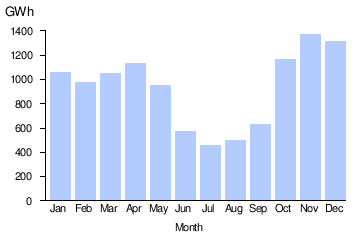
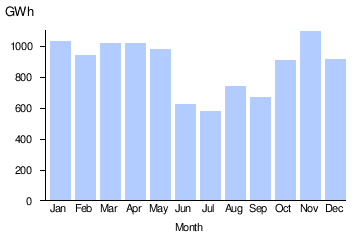
| Selected monthly wind generation profiles | |
|---|---|
United States (2016)
 |
Texas (2016)
 |
Oklahoma (2015)
 |
Iowa 2015
 |
California 2015
 |
Illinois 2015
 |
Kansas 2015
 |
Minnesota 2015
 |
| Year | Summer capacity (GW) |
Electricity generation (TWh) |
Capacity factor | Yearly growth of generating capacity |
Yearly growth of produced energy |
Portion of renewable electricity |
Portion of total electricity |
|---|---|---|---|---|---|---|---|
| 2017 | 87.54 | 254.26 | 0.332 | 7.7% | 12% | 37% | 6.33% |
| 2016 | 81.29 | 226.99 | 0.319 | 12.0% | 19% | 37.2% | 5.57% |
| 2015 | 72.58 | 190.72 | 0.300 | 12.0% | 5.00% | 35.04% | 4.68% |
| 2014 | 64.85 | 181.79 | 0.320 | 8.13% | 8.31% | 33.68% | 4.44% |
| 2013 | 59.97 | 161.84 | 0.319 | 1.51% | 19.19% | 32.15% | 4.13% |
| 2012 | 59.08 | 140.82 | 0.272 | 29.33% | 17.17% | 28.47% | 3.48% |
| 2011 | 45.68 | 120.18 | 0.300 | 16.71% | 26.97% | 23.41% | 2.93% |
| 2010 | 39.14 | 94.65 | 0.276 | 14.11% | 28.10% | 22.15% | 2.29% |
| 2009 | 34.30 | 73.89 | 0.246 | 39.15% | 33.47% | 17.69% | 1.87% |
| 2008 | 24.65 | 55.36 | 0.256 | 49.21% | 60.70% | 14.53% | 1.34% |
| 2007 | 16.52 | 34.45 | 0.238 | 45.81% | 29.56% | 9.77% | 0.83% |
| 2006 | 11.33 | 26.59 | 0.268 | 30.08% | 49.30% | 6.89% | 0.65% |
| 2005 | 8.71 | 17.81 | 0.233 | 34.83% | 25.95% | 4.98% | 0.44% |
| 2004 | 6.46 | 14.14 | 0.250 | 7.67% | 26.36% | 4.02% | 0.36% |
See also
- American Wind Energy Association
- List of wind farms in the United States
- Renewable energy in the United States
- Wind ENergy Data & Information (WENDI) Gateway
- Solar power in the United States
- Geothermal energy in the United States
- Biofuel in the United States
- Hydroelectric power in the United States
- Renewable energy by country
References
- 1 2 3 4 "AWEA 4th quarter 2014 Public Market Report" (PDF). American Wind Energy Association (AWEA). January 2014. Retrieved February 1, 2014.
- 1 2 "Electric Power Monthly" (PDF). Report. U.S. Department of Energy, Energy Information Administration. 4 Mar 2015.
- 1 2 3 4 5 6 7 "AWEA 2016 Fourth Quarter Market Report". AWEA. American Wind Energy Association. Retrieved 9 February 2017.
- ↑ "GWEC, Global Wind Report 2015, Annual Market Update" (PDF).
- 1 2 3 4 5 "US wind generation reached 5.5% of the grid in 2016". American Wind Energy Association. March 6, 2017.
- 1 2 3 "Alta Wind Energy Center is the nation's largest wind facility". California Energy Commission. California Energy Commission. Retrieved 12 December 2016.
- 1 2 American Wind Energy Association (2009). Annual Wind Industry Report, Year Ending 2008 Archived April 20, 2009, at the Wayback Machine. pp. 9–10.
- ↑ Corporation, Bonnier (2017-02-16). Popular Science. Bonnier Corporation.
- ↑ "Wind Energy Center Alumni | Wind Energy Center". www.umass.edu. Retrieved 2017-02-16.
- ↑ "The Wind Farms of the Altamont Pass Area". Annual Review of Energy. 12 (1): 145–183. 1987-01-01. doi:10.1146/annurev.eg.12.110187.001045.
- ↑ Shepherds Flat wind farm opening
- ↑ Eileen O'Grady. E.ON completes world's largest wind farm in Texas, Reuters, October 1, 2009.
- ↑ "Sweetwater Wind Farm". Archived from the original on February 19, 2011. Retrieved February 26, 2011.
- ↑ "Altamont Pass, California – Encyclopedia of Earth". eoearth.org. Retrieved June 2, 2008.
- ↑ Ron Pernick (2012). "Clean Energy Trends 2012" (PDF). Clean Edge. p. 5.
- ↑ US Energy Information Administration, Levelized cost of new generation resources, 28 January 2013.
- ↑ "Kansas Senate chairman cuts off questions about Koch funding at energy hearing". The Wichita Eagle.
- ↑ Dave Levinthal. "Inside the Koch brothers' campus crusade". Center for Public Integrity.
- ↑ "The True Benefits of Wind Power". Newsweek. 2015-04-21. Retrieved 2017-02-16.
- ↑ Simmons, Randy; Yonk, Ryan; Hansen, Megan (July 2015), The True Cost of Energy: Wind (PDF), Utah State University, retrieved 7 July 2015
- ↑ Shauna Theel (7 July 2015). "Koch-funded study on cost of wind flawed throughout". American Wind Energy Association. Retrieved 27 April 2016.
- ↑ "Electric Power Monthly" (PDF). U.S. Department of Energy. February 2013. Retrieved February 16, 2013.
- 1 2 "Electric Power Monthly" (PDF). U.S. Department of Energy. February 2014. Retrieved February 22, 2014.
- ↑ "Wind Powering America: Installed U.S. Wind Capacity and Wind Project Locations". U.S. Department of Energy. January 19, 2012. Archived from the original on March 14, 2014. Retrieved January 19, 2012.
- 1 2 "WINDExchange: Installed Wind Capacity". energy.gov. Office of Energy Efficiency and Renewable Energy, United States Department of Energy. March 5, 2010. Retrieved January 24, 2017.
- ↑ "U.S. Wind Industry Fourth Quarter 2014 Market Report" (PDF). AWEA. January 27, 2016. Retrieved March 7, 2016.
- ↑ "AWEA 4th quarter 2013 Public Market Report" (PDF). American Wind Energy Association (AWEA). January 2014. Retrieved February 1, 2014.
- ↑ Kingdom, Elsevier Ltd, The Boulevard, Langford Lane, Kidlington, Oxford, OX5 1GB, United. "Global wind industry statistics 2008 - Renewable Energy Focus". www.renewableenergyfocus.com. Retrieved 2017-02-16.
- ↑ Diane Cardwell (March 20, 2014). "Wind Industry's New Technologies Are Helping It Compete on Price". New York Times.
- 1 2 3 4 "2014 Wind Technologies Market Report" (PDF). Office of Energy Efficiency and Renewable Energy, U.S. Department of Energy. U.S. Department of Energy, Office of Energy Efficiency and Renewable Energy. August 2015. Retrieved January 24, 2016.
- ↑ US Energy Information Administration, Table 6.7B, Capacity factors, Electric Power Monthly, October 2014.
- ↑ "New Wind Resource Maps and Wind Potential Estimates for the United States". WINDExchange, DOE. February 19, 2010. Retrieved January 24, 2017.
- ↑ "Estimates of Windy Land Area and Wind Energy Potential by State for Areas >= 30% Capacity Factor at 80m" (.xls). National Renewable Energy Laboratory (NREL). February 4, 2010. Retrieved January 24, 2017.
- ↑ U.S. Wind Resource even Larger than Previously Estimated: Government Assessment Archived February 24, 2010, at the Wayback Machine.
- ↑ "Alaska 50-Meter Wind Resource Map". Wind Powering America, DOE. Archived from the original on November 25, 2010. Retrieved February 26, 2011.
- ↑ "Hawaii 80-Meter Wind Resource Map". Wind Powering America, DOE. Archived from the original on October 15, 2011. Retrieved February 26, 2011.
- ↑
- Lu, Xi; McElroy, Michael; Kiviluoma, Juha (June 22, 2009). "Global potential for wind generated electricity" (PDF). Proceedings of the National Academy of Sciences. 106 (27): 10933–8. doi:10.1073/pnas.0904101106. PMC 2700152. PMID 19549865. Retrieved June 27, 2009.
- ↑ Schwartz, Marc; Heimiller, Donna (June 2010). "Assessment of Offshore Wind Energy Resources for the United States" (PDF). National Renewable Energy Lab (NREL). Retrieved September 10, 2010.
- 1 2 3 20% Wind Energy by 2030: Increasing Wind Energy's Contribution to U.S. Electricity Supply. United States Department of Energy, Office of Energy Efficiency and Renewable Energy. "Archived copy" (PDF). Archived from the original (PDF) on May 2, 2013. Retrieved May 24, 2014. July 2008
- 1 2 "Strengthening America's Energy Security with Offshore Wind" (PDF). U.S. Department of Energy. February 2011.
- ↑ Zehnder, Alan; Warhaft, Zellman. "University Collaboration on Wind Energy" (PDF). Cornell University. Archived from the original (PDF) on September 1, 2011. Retrieved January 23, 2012.
- ↑ Corina Rivera Linares. "While investment may slow in coming years, plenty of transmission construction, investment happening". Archived from the original on 21 March 2016. Retrieved 22 March 2016.
- ↑ Herman K. Trabish (17 February 2016). "Powered by PTC, wind energy expected to keep booming despite Clean Power Plan stay". Utility Dive. Retrieved 27 April 2016.
- 1 2 EERE - U.S. Wind Power Achieves Landmark Installed Capacity
- ↑ "AWEA 4th quarter 2013 Public Market Report" (PDF). American Wind Energy Association (AWEA). January 2014. Retrieved February 1, 2014.
- ↑ Galbraith, Kate (2008-07-19). "Texas Approves a $4.93 Billion Wind-Power Project". The New York Times. ISSN 0362-4331. Retrieved 2017-02-16.
- ↑ "2009 Wind Technologies Market Report" (PDF). Office of Energy Efficiency and Renewable Energy, Lawrence Berkeley National Lab. August 18, 2010. Retrieved March 6, 2016.
- ↑ EC&R Completes 780-MW Roscoe Wind Farm Renewable Energy World, 2 October 2009.
- ↑ O'Grady, Eileen (October 1, 2009). "E.ON completes world's largest wind farm in Texas". Reuters.
- ↑ AWEA 3rd quarter 2008 Market Report Archived March 25, 2009, at the Wayback Machine.
- ↑ "AWEA 3rd Quarter 2008 Market Report" (PDF). American Wind Energy Association. Retrieved February 2, 2017.
- ↑ Texas Renewable Energy Industries Association. Texas operational wind plants Archived December 30, 2006, at the Wayback Machine.
- ↑ 196 Wind Turbines Cranking Out Power
- ↑ E.ON Delivers 335-MW of Wind in Texas
- ↑ "California Daily Renewables Watch" (PDF). California ISO. Retrieved February 16, 2017.
- ↑ "Overview of Wind Energy in California". California Energy Commission. May 15, 2009. Retrieved December 2, 2009.
- 1 2 3 "U.S. Wind Energy Projects – Washington". American Wind Energy Association. July 2010. Archived from the original on December 31, 2008. Retrieved July 28, 2010.
- ↑ Iowa Wind Energy Council - Iowa Wind Energy Fact Sheet March 2016
- ↑ Karen Ulenhuth. "MidAmerican Energy installing a concrete tower for the tallest land-based wind turbine in the U.S." Midwest Energy News. RE-AMP. Retrieved 20 November 2015.
- ↑ "Iowa to extend wind power lead as Invenergy plans 400 MW". Utility Dive. Retrieved 2018-09-27.
- ↑ "Wind Energy". Oklahoma Department of Commerce. Archived from the original on January 15, 2014. Retrieved January 14, 2014.
- ↑ "Illinois Incentives/Policies for Renewables & Efficiency". Database of State Incentives for Renewables and Efficiency. U.S. Dept. of Energy. Archived from the original on July 16, 2011. Retrieved May 17, 2010.
- ↑ "WIND ENERGY FACTS: ILLINOIS" (PDF). American Wind Energy Association. Archived from the original (PDF) on February 15, 2013. Retrieved February 17, 2013.
- ↑ staff. "Kansas is propelling growth in wind energy". Governors Wind Energy Coalition. Retrieved 14 January 2014.
- ↑ Utility-Scale Land-Based 80-Meter Wind Maps. WINDExchange. U.S. Dept. of Energy. Retrieved 2 February 2017.
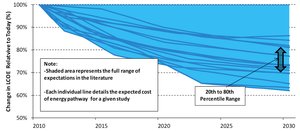
- ↑ E. Lantz, M. Hand, and R. Wiser (May 13–17, 2012) "The Past and Future Cost of Wind Energy," National Renewable Energy Laboratory conference paper no. 6A20-54526, page 4
- 1 2 3 "The Economic Reach of Wind". www.renewableenergyworld.com. Retrieved 2017-02-16.
- ↑ "Acciona Celebrates Completion of First Wind Turbine Production Plant in U.S." Technology For Life. 2008-01-20. Retrieved 2017-02-16.
- ↑ "enXco Closes Financing on Shiloh II Wind Project". www.renewableenergyworld.com. Retrieved 2017-02-16.
- ↑ "DOE Announces Effort to Advance U.S. Wind Power Manufacturing Capacity". Energy.gov. Retrieved 2017-02-16.
- 1 2 Wiser, Ryan H., and Mark Bolinger. "2014 Wind Technologies Market Report" page v+56. Lawrence Berkeley National Laboratory, August 2015.
- ↑ "New Wind Power Partnerships to Benefit Industry and Nation - News Releases | NREL". www.nrel.gov. Retrieved 2017-02-16.
- ↑ "UPC Wind Signs Agreement with Department of Energy to Establish National Wind technology Center on Maui". First Wind. April 1, 2008. Archived from the original on December 28, 2008. Retrieved December 2, 2009.
- ↑ "Secretary Chu Announces Efforts to Strengthen U.S. Electric Transmission Networks". Energy.gov. Retrieved 2017-02-16.
- ↑ "National Electric Transmission Congestion Study | Department of Energy". energy.gov. Retrieved 2017-02-16.
- ↑ US Dept. of Energy, Renewable electricity production tax credit, accessed 20 July 2015.
- ↑ Wind Power Today 2010. EERE Wind Energy Technologies Office and Water Power Technologies Office. May 2010.
- 1 2 Gerhardt, Tina (6 January 2013). "Wind Energy Gets a Boost off Fiscal Cliff Deal". The Progressive.
- ↑ "Renewable Electricity Production Tax Credit (PTC) | Department of Energy". energy.gov. Retrieved 2017-02-16.
- ↑ "Direct Federal Financial Interventions and Subsidies in Energy in Fiscal Year 2013". Analysis & Projections. Energy Information Administration. 23 March 2015. Retrieved 23 January 2015.
- ↑ "Forget Oil Exports—What Just Happened to Solar is a Really Big Deal". Bloomberg.com. 2015-12-17. Retrieved 2017-02-16.
- ↑ Jones, Tim (December 11, 2007). "More farmers seeing wind as cash crop". Chicago Tribune. Retrieved December 6, 2008.
- ↑ "Stabilizing Climate" Archived September 26, 2007, at the Wayback Machine. in Lester R. Brown, Plan B 2.0 Rescuing a Planet Under Stress and a Civilization in Trouble (NY: W.W. Norton & Co., 2006), p. 191.
- ↑ "Legendary Texas oilman embraces wind power". Star Tribune. July 25, 2008. Archived from the original on July 27, 2008. Retrieved August 24, 2008.
- ↑ Fahey, Anna (July 9, 2008). "Texas Oil Man Says We Can Break the Addiction". Sightline Daily. Retrieved August 24, 2008.
- ↑ "T. Boone Pickens Places $2 Billion Order for GE Wind Turbines". Wind Today Magazine. May 16, 2008. Archived from the original on October 1, 2008. Retrieved August 24, 2008.
- ↑ Star, The Prairie. "Ag Weekly". www.agweekly.com. Retrieved 2017-02-16.
- ↑ "Gone with the wind", New Scientist, 8 July 2006, pp. 36–39.
- ↑ "WINDExchange: Resources and Tools for Siting Wind Turbines". apps2.eere.energy.gov. Retrieved 2017-02-16.
- 1 2 Bollinger, Mark (August 2014). "2013 Wind Technologies Market Report". LBNL.
- 1 2 "Landmark Report Analyzes Current State of U.S. Offshore Wind Industry" (PDF). NREL Highlights. 2011.
- 1 2 3 Environmental and Energy Study Institute. "Offshore Wind Factsheet".
- ↑ Jeremy Firestone, Willett Kempton. "Public opinion about large offshore wind power: Underlying factors" (PDF). Archived from the original (PDF) on October 9, 2011.
- ↑ Dan Wilhelmsson; et al. "Greening Blue Energy: Identifying and managing the biodiversity risks and opportunities of offshore renewable energy" (PDF). International Union for Conservation of Nature and Natural Resources.
- ↑ "DOI Announces Five Exploratory Leases for Offshore Wind Energy". www.renewableenergyworld.com. Retrieved 2017-02-16.
- ↑ Areas under consideration for wind energy areas Archived February 12, 2011, at the Wayback Machine. U.S. Department of Energy. Accessed: February 8, 2011.
- 1 2 A national offshore wind strategy: Creating an offshore wind energy industry in the United States page iii U.S. Department of Energy, February 7, 2011. Accessed: February 8, 2011. "no wind turbines are installed in U.S. waters"
- ↑ Lord, Peter B. (April 24, 2009). "Deepwater wind project making headway". The Providence Journal. Retrieved April 29, 2009.
- ↑ "Rhode Island Chooses Deepwater Wind to Build Off-Shore Wind Farm". RenewableEnergyWorld.com. September 30, 2008. Retrieved April 29, 2009.
- ↑ Nesi, Ted (April 22, 2009). "U.S. offshore wind rules expected today". Providence Business News. Archived from the original on April 26, 2009. Retrieved April 29, 2009.
- ↑ Turkel, Tux (January 3, 2010). "Offshore wind power: Can Maine afford it?". Portland Press Herald. Retrieved January 8, 2010.
- ↑ "GMI Awarded New Jersey Ocean/Wind Power Ecological Baseline Studies". North American Wind Power. November 15, 2007. Retrieved June 6, 2011.
- ↑ "Offshore Wind Energy Study Puts New Jersey in Lead Nationally in Creating Environmentally Safer Energy Source". New Jersey Department of Environmental Protection. June 18, 2010. Retrieved June 6, 2011.
- ↑ Conaboy, Chelsea (June 19, 2010), "Study favorable for proposed N.J. offshore wind farms", Philadelphia Inquirer, retrieved June 3, 2011
- ↑ "Ocean/Wind Power Baseline Ecological Studies". State of New Jersey Department of Environmental Protection. July 23, 2010. Retrieved June 6, 2011.
- ↑ Waltz, Emily (October 20, 2008), "Offshore Wind May Power the Future Not only are offshore winds stronger but landlubbers have fewer objections to turbines almost invisible from the coast", Scientific America, retrieved June 6, 2011
- 1 2 "Offshore Wind Power Line Wins Praise, and Backing" article by Matthew L. Wald in The New York Times October 12, 2010, Accessed October 12, 2010
- ↑ Frank Maisano (January 17, 2013). "Offshore Wind Transmission Project Selects Bechtel, Alstom to Build Historic Project" (PDF) (Press release). Atlantic Grid Development, LLC. Retrieved January 24, 2013.
- 1 2 3 Junling Huang, Xi Lu and Michael B. McElroy (2014). "Meteorologically defined limits to reduction in the variability of outputs from a coupled wind farm system in the Central US" (PDF). Renewable Energy. 62: 331–340 (p13+15+26). doi:10.1016/j.renene.2013.07.022.
- ↑ Lu, Xi; McElroya, Michael B.; Kiviluoma, Juha (July 2009). "Global potential for wind-generated electricity: Correlation table between Montana (MT), Minnesota (MN), and Texas (TX)". Proceedings of the National Academy of Sciences of the United States of America. 106 (27): 10933–10938. doi:10.1073/pnas.0904101106. PMC 2700152. PMID 19549865.
- 1 2 Associated Press, "US to allow eagle deaths – to aid wind power", Washington Post, 6 Dec. 2013.
- ↑ United States Fish and Wildlife Service, Land-Based Wind Energy Guidelines Archived May 28, 2014, at the Wayback Machine., Mar. 2012.
- ↑ Dina Cappiello, "Wind farms get pass on eagle deaths", Associated Press, 14 May 2013.
- ↑ Soumya Karlamangla, "Energy company to pay $1 million in wind turbine eagle deaths", Los Angeles Times, 24 Nov. 2013.
- ↑ Eyder Peralta, Duke Energy Pleads Guilty Over Eagle Deaths At Wind Farms", National Public Radio, 23 Nov. 2013.
- ↑ American Wind Energy Association, AWEA Statement on U.S. Fish & Wildlife Service's Eagle Permit Tenure Rule, 6 Dec. 2013.
- ↑ American Bird Conservancy, Opposition to 30-Year Eagle Take Permits, accessed 8 December 2013.
- ↑ Audubon Society, Interior Dept. Rule Greenlights Eagle Slaughter at Wind Farms, Says Audubon CEO, 5 December 2013.
- 1 2 3 "30,000 Wind Turbines Located in critical bird habitats".
- ↑ "Threats to birds from Wind Turbines".
- ↑ "Wildlife protection laws and offshore wind energy development in the US".
- ↑ http://www.eia.gov/electricity/monthly/index.cfm#tabs_unit-3
- ↑ "Electric Power Annual". US Energy Information Administration. Retrieved 2018-06-02.
- ↑ "Electric Power Monthly". US Energy Information Administration.
External links
| Wikimedia Commons has media related to |
- Wind Map
- Wind Energy in the U.S. Factsheet by the University of Michigan's Center for Sustainable Systems
- A New Era for Wind Power in the United States, a 2013 DOE report
- GA Mansoori, N Enayati, LB Agyarko (2016), Energy: Sources, Utilization, Legislation, Sustainability, Illinois as Model State, World Sci. Pub. Co., ISBN 978-981-4704-00-7
| Wind power by state |
| |
|---|---|---|
| Large wind farms | ||
| Wind power companies | ||
| ||
| Wind power | ||
|---|---|---|
| Wind turbines | ||
| Wind power industry | ||
| Wind farms | ||
| Concepts | ||
| ||
| Africa | |||||
|---|---|---|---|---|---|
| Asia | |||||
| Europe |
| ||||
| North America | |||||
| Oceania | |||||
| South America | |||||
| |||||