Solar power in Nevada
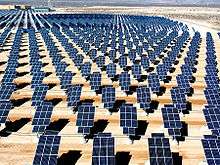
Solar power in Nevada has been growing, due to a Renewable Portfolio Standard which requires 20% renewable energy by 2015, and 5% from solar power.[1] Nevada, at the end of 2007, became home to then-largest photovoltaic power plant in the world, the 14.2 megawatt (peak) Nellis Solar Power Plant, which, by selling the renewable energy credits (RECs), was able to provide Nellis Air Force Base with electricity for only 2.2 cents/kWh, compared to the 9 cents they are paying Nevada Power.[2] Since then many larger solar power stations have been built in Nevada, with more proposed.
Nevada has vast deserts, and is capable of providing a great amount of solar power. The Nellis power plant only occupies 140 acres (57 ha) of land.
Solar Power Plants
Notable solar power plants in Nevada include the Nellis and Nellis II photovoltaic solar power plants at Nellis Air Force Base; the 64 MW, 400 acre concentrating solar thermal power plant Nevada Solar One, which began operation in 2007; and the proposed 100 MW Playa Solar 2 project. The 100 MW Playa Solar 2 project is a photovoltaic power station proposed by First Solar with a 20-year power purchase agreement with NV Energy for $0.0378 per kilowatt-hour. This is lower than the lowest price available in the previous year of $0.046[3] (from the 100 MW Boulder Solar plant).
Some geothermal power plants struggle to keep up power during hot sunny hours due to the higher bottom of the thermodynamic cycle, and are augmented by photovoltaic and/or solar thermal equipment which peak at that time.[4][5][6]
See the list of power stations in Nevada, which includes solar power plants in Nevada, as well as generation facilities based on other sources.
Solar Related Businesses in Nevada
Prominent Nevada-based solar installation companies include Radiant Solar, Summerlin Energy, Bombard Renewable Energy, and Hamilton Solar.[7]
Nevada had 129 MW in private installations of rooftop solar in 2015.[8]
Incentives
The federal Residential Energy Efficient Property Credit (income tax credit on IRS Form 5695) for residential PV and solar thermal was extended in December 2015 to remain at 30% of system cost (parts and installation) for systems put into service by the end of 2019, then 26% until the end of 2020, and then 22% until the end of 2021. It applies to a taxpayer's principal and/or second residences, but not to a property that is rented out. There is no maximum cap on the credit, and the credit can be applied toward the Alternative Minimum Tax, and any excess credit (greater than that year's tax liability) can be rolled into the following year.[9][10]
Net Metering Controversy
Net energy metering rules were changed in December 2015, unfavorably for homeowners having or considering rooftop solar, and were applied even to existing installations. Some major installers, including SolarCity, Vivint, and SunRun, withdrew from the Nevada market.
After a public outcry, the earlier favorable rules were grandfathered for up to 32,000 customers whose systems were active or had a pending application by December 31, 2015.[11][12][13][14][15][16] The Public Utilities Commission of Nevada approved bill AB405 in 2017 to restore net metering.[17]
Statistics
| Year | Capacity | Installed | % Change |
|---|---|---|---|
| 2007 | 18.8 | 15.9 | 548% |
| 2008 | 34.2 | 14.9 | 82% |
| 2009 | 36.4 | 2.5 | 6% |
| 2010 | 104.7 | 68.3 | 188% |
| 2011 | 124.1 | 19.4 | 19% |
| 2012 | 349.7 | 225.6 | 182% |
| 2013 | 424.0 | 74.3 | 21% |
| 2014 | 823 | 399 | 94% |
| 2015 | 1,240 | 417 | 51% |
Nevada utility scale solar electric generation::[26]
| Year | Generation (GWh) | Generation (% of NV total) | Generation (% of US Solar) |
|---|---|---|---|
| 2010 | 217 | 0.6% | 17.9% |
| 2011 | 290 | 0.9% | 16% |
| 2012 | 473 | 1.3% | 10.9% |
| 2013 | 749 | 2.1% | 8.2% |
| 2014 | 1,028 | 2.8% | 5.6% |
| 2015 | 1,658 | 4.2% | 6.6% |
| 2016 | 3,124 | 7.85% | 8.67% |
| 2017* | 3,835 | 10.1% | 7.24% |
(*) Preliminary data from Electric Power Monthly.
Beginning with the 2014 data year, Energy Information Administration has estimated distributed solar photovoltaic generation and distributed solar photovoltaic capacity. These non-utility scale estimates project that, Nevada, generated the following additional solar energy.
| Year | Summer capacity (MW) | Electric energy (GWh or M kWh) |
|---|---|---|
| 2014 | 49 | 86 |
| 2015 | 120.4 | 186 |
| 2016 | 209.5 | 372 |
| 2017 | 218.7 | 408 |
See also
References
| Wikimedia Commons has media related to Solar power in Nevada. |
- ↑ Energy Portfolio Standard Archived 2007-10-10 at the Wayback Machine.
- ↑ Solar panels at Nellis could be win-win
- ↑ Forbes (July 13, 2015). "First Solar Signs PPA With A Record Low Rates".
- ↑ DiMarzio, Angelini, Price, Dhin, Harris (April 2015). "The Stillwater Triple Hybrid Power Plant - Integrating Geothermal Solar Photovoltaic and Solar Thermal Power Generation" (PDF). Archived (PDF) from the original on 2016-03-05.
- ↑ "SolarWorld Americas supplies 14.2 MW of solar panels to Nevada solar+geothermal project". August 31, 2017. Retrieved September 10, 2017.
- ↑ "8/31 6:30p.m. Fallon Gets Another Brand New Solar Plant". KTVN Channel 2 News. August 31, 2017. Retrieved September 10, 2017 – via YouTube.
- ↑ Solar Power World
- ↑ 2016 State of the Interconnection page 15. WECC, 2016. Archive
- ↑ "Residential Renewable Energy Tax Credit". Energy.gov. US Department of Energy. Retrieved April 29, 2016.
- ↑ "Federal Income Tax Credits for Energy Efficiency". EnergyStar.gov. US EPA. Retrieved December 21, 2016.
- ↑ Roerink, Kyle. "NV Energy Rooftop Solar Cap Will Be Hit Saturday". The Las Vegas Sun.
- ↑ Whaley, Sean. "SolarCity Stopping Nevada Sales Installation After PUC Ruling". The Las Vegas Review Journal.
- ↑ Buhayar, Noah (January 28, 2016). "Who owns the sun?". Bloomberg Businessweek.
- ↑ "Nevada Supreme Court Blocks Rooftop Solar Referendum". Retrieved 9 August 2016.
- ↑ Gross, Damiel (January 22, 2016). "Why Solar Energy Is Fleeing Nevada". Slate.com. Retrieved December 22, 2016.
- ↑ Hidalgo, Jason (September 16, 2016). "Nevada regulators unanimously approve rooftop solar grandfathering deal". Reno Gazette-Journal. Retrieved December 22, 2016.
- ↑ "Public Utilities Commission of Nevada makes decision on solar energy bill". September 1, 2017. Retrieved September 7, 2017.
- ↑ Sherwood, Larry (July 2014). "U.S. Solar Market Trends 2013" (PDF). Interstate Renewable Energy Council (IREC). Retrieved 2014-07-17.
- ↑ Sherwood, Larry (July 2013). "U.S. Solar Market Trends 2012" (PDF). Interstate Renewable Energy Council (IREC). p. 16. Retrieved 2013-10-11.
- ↑ Sherwood, Larry (August 2012). "U.S. Solar Market Trends 2011" (PDF). Interstate Renewable Energy Council (IREC). Archived from the original (PDF) on 2012-09-06. Retrieved 2012-08-16.
- ↑ Sherwood, Larry (June 2011). "U.S. Solar Market Trends 2010" (PDF). Interstate Renewable Energy Council (IREC). Retrieved 2011-06-29.
- ↑ Sherwood, Larry (July 2010). "U.S. Solar Market Trends 2009" (PDF). Interstate Renewable Energy Council (IREC). Archived from the original (PDF) on 2010-09-25. Retrieved 2010-07-28.
- ↑ Sherwood, Larry (July 2009). "U.S. Solar Market Trends 2008" (PDF). Interstate Renewable Energy Council (IREC). p. 16. Archived from the original (PDF) on 2009-11-23. Retrieved 2010-07-24.
- ↑ Sherwood, Larry (August 2008). "U.S. Solar Market Trends 2007" (PDF). Interstate Renewable Energy Council (IREC). Retrieved 2010-07-24.
- ↑ Nevada Solar
- ↑ "Electric Power Monthly-Data Browser " retrieved 2018-3-17
- ↑ "Electric Power Monthly" retrieved 2016-3-10
- ↑ “Electric Power Monthly” |title=Electric Power Monthly (February 2018 with data for December 2017) - Table 6.2.B. Net Summer Capacity using Primarily Renewable Sources retrieved 2018 3 17
- ↑ “Electric Power Monthly” |title=Electric Power Monthly (February 2018 with data for December 2017) - Table 1.17.B. Net Generation from Solar Photovoltaic retrieved 2018 3 17