Wind power in Indiana

Wind power in Indiana was limited to a few small water-pumping windmills on farms until 2008 with construction of Indiana's first utility-scale wind power facility, Goodland (phase I) with a nameplate capacity of 130 MW. As of September 2017, Indiana had a total of 1897 MW of wind power capacity installed, ranking it 12th among U.S. states.[1] Wind power was responsible for 4.8% of in-state electricity production in 2016.[2]
The main utility-scale development up to 2016 has been in the northwest part of the state in Benton, White, and Jasper Counties. As of May 2017, Fowler Ridge Wind Farm was completed and has a final nameplate capacity of 750 MW, making it the Midwest's largest wind farm, and one of the largest in the world. Wind energy growth in Indiana continues, with 15 projects currently online, continually increasing the total installed capacity of the state.[3][4]
Installed capacity and wind resources
The following table compares the growth in wind power installed nameplate capacity in MW for Indiana and the entire United States since 2003.[5]
|
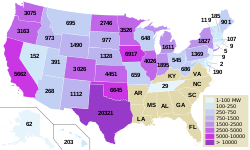 Installed capacity by state as of 2013 (animated map of installed capacity growth) |
 Average annual wind power density map for Indiana at 50m above ground | |||||||||||||||||||||||||||||||||||||||||||||
Currently, the state of Indiana ranks 12th in installed wind capacity and number of wind turbines with 1,897 MW and 1,096 turbines, respectively. Together, these yield 4.82% of the total in-state electricity production (~4,368,000 MWh or enough to power ~453,000 homes).[6][7] To put this number into perspective, Indiana consumed 104.514 TWh of electricity in 2015. However, the National Renewable Energy Laboratory predicts wind energy growth in Indiana, stating the wind potential (from turbines with an 80 m hub height) could reach levels upwards of 40,259 MW by 2030. This predicted potential growth is starting to materialize now, with 15 wind projects currently online in the state.[7]
Indiana also has some offshore wind resources in the shallows of Lake Michigan along its shoreline.[8][9][10] However, offshore wind power development is far behind onshore development in the United States generally, because onshore development is cheaper and the United States has an abundance of suitable onshore sites to develop. Indiana has no offshore wind farms as of 2018.
Wind generation
Indiana wind generation by month.
 |
| Indiana Wind Generation (GWh, Million kWh) | |||||||||||||
|---|---|---|---|---|---|---|---|---|---|---|---|---|---|
| Year | Total | Jan | Feb | Mar | Apr | May | Jun | Jul | Aug | Sept | Oct | Nov | Dec |
| 2012 | 3,163 | 416 | 307 | 374 | 386 | 212 | 185 | 113 | 94 | 162 | 324 | 234 | 357 |
| 2013 | 3,481 | 450 | 276 | 334 | 396 | 303 | 184 | 138 | 92 | 155 | 297 | 449 | 405 |
| 2014 | 3,495 | 415 | 252 | 323 | 388 | 304 | 190 | 167 | 101 | 158 | 325 | 507 | 366 |
| 2015 | 4,516 | 411 | 413 | 424 | 425 | 365 | 272 | 176 | 165 | 214 | 517 | 554 | 580 |
| 2016 | 3,885 | 656 | 572 | 510 | 451 | 403 | 280 | 164 | 148 | 241 | 460 | ||
| 2017 | 2,676 | 353 | 388 | 459 | 475 | 381 | 355 | 265 | |||||
Source:[11][12][13][14] As this graph indicates, Indiana generally tends to have more steady wind from Fall to Spring months, evidenced by the fact that even in Southern Indiana. Wind chill is a common factor of outside conditions. October and November, for example often see large variances in temperature, causing more days of strong gusty winds, thereby generating more wind electricity production. The same happens in March and April. But often in the Summer months the air tends to stagnate, resulting in less wind electricity production.
Wind farms
The following table of wind farms and utility-scale wind power developments uses data from the AWEA,[5] the State of Indiana,[15] and other sources. For the larger projects constructed in phases, the table lists separate information for each phase. The name of each wind farm is the name used by the energy company when referring to the farm. The Wind Farm suffix is implied and hence removed for brevity. For more details and references for each wind farm, see its article.
| Wind farm | County(s) | Turbine model | Power per turbine (MW) | No. of Turbines | Total Nameplate Capacity (MW) | Online | Developer | Operator | Power purchaser | Coordinates | |
|---|---|---|---|---|---|---|---|---|---|---|---|
| Benton County phase I | Benton | GE sl/sle Gen4 | 1.5 | 87 | 130.5 | 2008-04 | Orion Energy | Orion Energy | Duke, Vectren | 40°41′10″N 87°24′29″W / 40.686°N 87.408°W | |
| Fowler Ridge phase I Vestas | Benton | Vestas V82 | 1.65 | 182 | 300.3 | 2009-04 | BP, Dominion | BP, Dominion | AEP, Dominion | 40°36′29″N 87°19′12″W / 40.608°N 87.320°W | |
| Fowler Ridge phase I Clipper | Benton | Clipper 2.5 | 2.5 | 40 | 100 | 2009-04 | BP, Dominion | BP, Dominion | AEP, Dominion | 40°36′29″N 87°19′12″W / 40.608°N 87.320°W | |
| Fowler Ridge phase II | Benton | GE sl/sle Gen4 | 1.5 | 133 | 199.5 | 2009-12 | BP, Dominion | BP, Dominion | AEP, Vectren | 40°36′29″N 87°19′12″W / 40.608°N 87.320°W | |
| Headwaters | Randolph | Vestas V110 | 2 | 100 | 200 | December 2014 | EDP Renewables North America | EDP Renewables North America | Indiana Michigan Power | ||
| Hoosier | Benton | REpower | 2 | 53 | 106 | 2009-08 | IPL, enXco | IPL, enXco | IPL | 40°36′N 87°19′W / 40.6°N 87.32°W | |
| Meadow Lake phase I | White | Vestas V82 | 1.65 | 121 | 199.65 | October 2009 | Horizon Wind Energy | EDP Renewables North America | AEP, wholesale market | 40°36′04″N 86°51′54″W / 40.601°N 86.865°W | |
| Meadow Lake phase II | White | Acciona | 1.5 | 66 | 99 | June 2010 | Horizon Wind Energy | EDP Renewables North America | 40°36′04″N 86°51′54″W / 40.601°N 86.865°W | ||
| Meadow Lake phase III | White | GE | 1.5 | 69 | 103.5 | October 2010 | Horizon Wind Energy | EDP Renewables North America | 40°36′04″N 86°51′54″W / 40.601°N 86.865°W | ||
| Meadow Lake phase IV | White | Suzlon | 2.1 | 47 | 98.7 | October 2010 | Horizon Wind Energy | EDP Renewables North America | 40°36′04″N 86°51′54″W / 40.601°N 86.865°W | ||
| Prairie Breeze | Tipton | 1.6 | 94 | 150 | Juwi | 40°21′40″N 86°09′07″W / 40.361°N 86.152°W | |||||
| Union City/Randolph Eastern School Corporation | Randolph | Nordic Windpower | 1 | 2 | 2 | 2010-02 | Performance Services | Union City, Randolph Eastern School Corporation | AEP | 40°12′04″N 84°48′54″W / 40.201°N 84.815°W | |
| Wildcat phase I | Madison, Tipton | GE | 1.6 | 125 | 200 | 2012-10 | E.ON | E.ON | AEP | 40°21′07″N 85°52′55″W / 40.352°N 85.882°W | |
| Wildcat phase II | Grant, Howard | 40-60 | (proposed) | E.ON | 40°28′48″N 85°51′36″W / 40.480°N 85.860°W | ||||||
| Wildcat phase III | Tipton | 40-75 | (proposed) | E.ON | |||||||
| Wildcat phase IV | Tipton | (proposed) | E.ON | ||||||||
Single-unit turbines
In addition to the above wind farms, single stand-alone units have also been built in multiple other locations, mostly at schools. Some of these units were placed to test the environment for future wind energy development.[16][17][18] [19] [20]
| Location | County | Owner | Wind speed (m/s) |
Power (Kw) |
|---|---|---|---|---|
| Akron | Kosciusko | Tippecanoe Valley School Corporation | 6.5 m/s (14.5 mph) | 900 |
| Middletown | Henry | Shenandoah School Corporation | 900 | |
| Carthage | Shelby | 7.7 / 99m | ||
| Haubstadt | Gibson | South Gibson School Corporation | 6.1 / 99m | |
| Kokomo | Howard | Northwestern School Corporation | 7.0 / 99m | |
| LaGrange | LaGrange | 7.0 / 99m | ||
| Upland | Grant | Taylor University | ||
| Francesville | Pulaski | West Central School Corporation | 6.9 | 900 |
Environmental impact
According to the USDOE, each 1000 MW of wind power capacity installed in Indiana will annually save 1,684 million gallons of water and eliminate 3.1 million tons of carbon dioxide emissions.[21]
For comparison, Indiana emitted a total of 1,883 lbs/MWh of carbon dioxide in 2015.[22][23][24]
As of March 2010 Indiana lacked a renewable energy standard, unlike several other midwestern states: Ohio, Illinois, Michigan, Minnesota, Missouri and Iowa.[25] Nevertheless, Indiana's wind power development had outpaced that of Ohio and Michigan.
Government policies and initiatives
The Indiana State government, along with the Federal Government, has put many incentives in place for the use of wind energy. The three main categories of incentives are 1) utility, 2) state, and 3) federal.
Utility
Utility incentives target customers that have their own small wind energy systems (no greater than 1 MW). These incentives consist of 1) Net Metering and 2) Feed in Tariff (FIT) incentives. Net metering allows the utility company to track the energy the wind system produces and customers can then use that energy as a credit on their bills. The FIT program, only adopted by the utility company Northern Indiana Public Service Company (NIPSCO), pays their customers per kW of energy produced by their wind turbine, opposed to offering a credit. Currently NIPSCO mandates a rate of $0.17/kWh for systems less than or equal to 100 kW and $0.10/kWh for systems 100kW-2MW.[26]
State
State-level incentives consist of the 1) Renewable Energy Property Tax Exemption and 2) Indiana Sales Tax Incentive for Electrical Generating Equipment. The renewable energy exemption states that the assessed value of any wind system installed after December 31, 2011 is eligible for property tax exemption pending the completion of state form 18865. The sales tax incentive states that the equipment used to produce renewable electricity are eligible for a sales tax exemption. The state of Indiana also implemented a voluntary Clean Energy Portfolio Standard (CPS) in May 2011. The CPS set a goal for the state to have 10% of its electric generation come from clean energy by 2025.[26]
Federal
Federal Incentives include 1) The Rural Energy for America Program (REAP), 2) Business Energy Investment Tax Credit, and 3) Residential Renewable Energy Tax Credit. The REAP program provides grants to agricultural producers and rural businesses for projects that yield more energy efficiency and renewable energy. The Business Energy Tax Credit, as of 9/18/2017, is only available to large wind turbines (greater than 100 kW in capacity) and will expire 12/31/2019. The credit is currently at a rate of 24% of invested expenditures with no credit cap. The Residential Renewable Energy Tax Credit is similar to the Business Investment credit except only small turbines qualify (cannot exceed 100 kW). As of 9/18/2017, the tax credit is at 30% with no max. This credit will also expire 12/31/2019.[26]
See also
| Wikimedia Commons has media related to Wind power in Indiana. |
References
- ↑ "Indiana Wind Energy" (PDF). American Wind Energy Association.
- ↑ "Indiana Wind Energy" (PDF). U.S. Wind Energy State Facts. American Wind Energy Association. Retrieved 27 December 2017.
- ↑ "Indiana Wind Energy" (PDF). American Wind Energy Association.
- ↑ "Meadow Lake Update" (PDF). Horizon Wind Energy. 2009-07-15. Retrieved 2010-03-16.
- 1 2 "U.S. Wind Energy Projects - Indiana". American Wind Energy Association. 2010-09-30. Retrieved 2011-03-07.
- ↑ "EIA - State Electricity Profiles". www.eia.gov. Retrieved 2017-10-11.
- 1 2 "Indiana Wind Energy" (PDF). American Wind Energy Association.
- ↑ Bradley, David (2004-02-06). "A Great Potential: The Great Lakes as a Regional Renewable Energy Source" (PDF). Archived from the original (PDF) on 2009-03-25. Retrieved 2008-10-04.
- ↑ "Great Lakes eyed for offshore wind farms". MSNBC, Associated Press. 2008-10-31. Retrieved 2008-11-14.
- ↑ "Momentum Grows for Great Lakes Offshore Wind". NewEnergyNews. 2008-10-31. Retrieved 2008-11-15.
- ↑ EIA (July 27, 2012). "Electric Power Monthly Table 1.17.A." United States Department of Energy. Retrieved 2012-08-15.
- ↑ EIA (July 27, 2012). "Electric Power Monthly Table 1.17.B." United States Department of Energy. Retrieved 2012-08-15.
- ↑ EIA (February 2013). "Electric Power Monthly Table 1.17.A." (PDF). United States Department of Energy. Retrieved 2013-05-24.
- ↑ EIA (February 2016). "Electric Power Monthly Table 1.17.A." (PDF). United States Department of Energy. Retrieved 2016-04-03.
- ↑ "Indiana Office of Energy Development - Wind Power". IN.gov - Official Website of the State of Indiana. Retrieved 2010-03-23.
- ↑ ams.confex.com/ams/pdfpapers/91911.pdf
- ↑ http://www.insideindianabusiness.com/newsitem.asp?ID=39751
- ↑ http://www.taylor.edu/sciencecomplex/about/wind-turbines.shtml
- ↑ http://www.wcsc.k12.in.us/index.php?option=com_content&view=article&id=65:wind-turbine&catid=2&Itemid=214
- ↑ http://www.kchamber.com/news/details/news-release-10-21-2014
- ↑ Lantz, Eric; Tegen, Suzanne (May 2008). "Economic Benefits, Carbon Dioxide (CO2) Emissions Reductions, and Water Conservation Benefits from 1,000 Megawatts (MW) of New Wind Power in Indiana" (PDF, 503kB). EERE, NREL. Retrieved 2010-03-17.
- ↑ "EIA - State Electricity Profiles". www.eia.gov. Retrieved 2017-09-25.
- ↑ http://www.epa.gov/climatechange/emissions/downloads/CO2FFC_2007.pdf
- ↑ http://www.epa.gov/climatechange/emissions/downloads/CO2FFC_2007.xls
- ↑ Slabaugh, Seth (2010-01-11). "Indiana not promoting wind energy like its neighbors". Retrieved 2010-03-23.
- 1 2 3 "OED: Wind Power". www.in.gov. Retrieved 2017-10-11.
| Wind power by state |
| |
|---|---|---|
| Large wind farms | ||
| Wind power companies | ||
| ||