Greenhouse gas emissions by the United States


According to the U.S. Environmental Protection Agency (EPA), the United States produced 6,587 million metric tonnes of carbon-dioxide equivalent greenhouse gas (GHG) emissions in 2015. Compared to 2014 levels, U.S. greenhouse gas emissions decreased in 2015. Compared to levels in 1990, emissions have increased by about 4 percent. From year to year, emissions can rise and fall due to changes in the economy, the price of fuel, and other factors. The EPA has attributed recent decreases to a reduction in emissions from fossil fuel combustion, which was a result of multiple factors including substitution from coal to natural gas consumption in the electric power sector; warmer winter conditions that reduced demand for heating fuel in the residential and commercial sectors; and a slight decrease in electricity demand.[1]
While the Bush administration opted against Kyoto-type policies to reduce emissions, the Obama administration and various state, local, and regional governments have attempted to adopt some Kyoto Protocol goals on a local basis. For example, the Regional Greenhouse Gas Initiative (RGGI) founded in January 2007 is a state-level emissions capping and trading program by nine northeastern U.S. states. In December 2009 President Obama set a target for reducing U.S. greenhouse gas (GHG) emissions in the range of 17% below 2005 levels by 2020.[2]
The U.S. State Department offered a nation-level perspective in the Fourth US Climate Action Report (USCAR) to the United Nations Framework Convention on Climate Change, including measures to address climate change. The report showed that the country was on track to achieve President Bush's goal of reducing greenhouse gas emissions per unit of gross domestic product) by 18% from 2002 to 2012. Over that same period, actual GHG emissions were projected to increase by 11%. The report estimated that in 2006, U.S. GHG emissions decreased 1.5% from 2005 to 7,075.6 million tonnes of carbon dioxide equivalent. This was an increase of 15.1% from the 1990 levels of 6,146.7 million tonnes (or 0.9% annual increase), and an increase of 1.4% from the 2000 levels of 6,978.4 million tonnes. By 2012 GHG emissions were projected to increase to more than 7,709 million tonnes of carbon dioxide equivalent, which would be 26% above 1990 levels.
General
According to a 2016 study U.S. methane emissions were underestimated by the EPA since at least a decade, on the order of 30 to 50 percent.[3]
2007
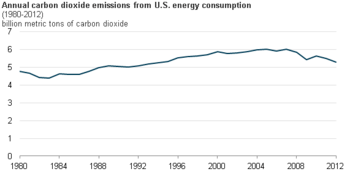
U.S. carbon dioxide emissions from energy use rose by 1.6% in 2007, according to preliminary estimates by the United States Department of Energy's Energy Information Administration (EIA). Electricity generation increased by 2.5%, and carbon dioxide emissions from the power sector increased even more, at 3%, indicating that U.S. utilities shifted towards energy sources that emitted more carbon. That shift was partially caused by a 40 billion kilowatt-hour decrease in hydropower production causing a greater reliance on fossil fuels like natural gas and coal. Carbon dioxide emissions from power plants fueled with natural gas increased by 10.5%, while coal-burning power plants increased their emissions by 1.8%.[4] Paper is the fourth largest contributor to greenhouse gas emissions in the United States and one of the largest consumers of industrial water among all Organisation for Economic Co-operation and Development (OECD) countries.[5][6][7]
In 2007 the National Oceanic and Atmospheric Administration stated that the "U.S. and global annual temperatures are now approximately 1.0°F warmer than at the start of the 20th century, and the rate of warming has accelerated over the past 30 years, increasing globally since the mid-1970s at a rate approximately three times faster than the century-scale trend. The past nine years have all been among the 25 warmest years on record for the contiguous U.S., a streak which is unprecedented in the historical record."[8]
Carbon emissions by categories
A study completed in 2015[9] provides a breakdown of how much CO2 emissions are created by certain parts of the United States economy. The largest group being electricity production accounting for 37% of carbon emissions, followed by personal ground travel at 22%, natural gas not used towards power at 11%, movement of goods by boat, truck, or air at 9%, oil refining at 6%, other uses of petroleum at 6%, jet fuel, specifically for air travel, at 4%, and the last 5% spread among other miscellaneous uses. A large portion of carbon emissions created by the United states is from personal use. The University of Michigan created a detailed list of steps that can be taken to lower personal carbon emissions.[10]
Reporting requirement
Since January 1, 2010 the USEPA's Mandatory Reporting of Greenhouse Gases rule, requires thousands of companies in the US to monitor their greenhouse gas emissions and begin reporting them in 2011.[11] A detailed inventory of fossil fuel CO2 emissions is provided by the Project Vulcan.[12]
Reduction target
The White House announced on 25 November 2009 that President Barack Obama is offering a U.S. target for reducing greenhouse gas emissions in the range of 17% below 2005 levels by 2020. The proposed target agrees with the limit set by climate legislation that has passed the U.S. House of Representatives, but the U.S. Senate is currently considering a bill that cuts GHG emissions to 20% below 2005 levels by 2020. The White House noted that the final U.S. emissions target will ultimately fall in line with the climate legislation, once that legislation passes both houses of Congress and is approved by the President. In light of the president's goal for an 83% reduction in GHG emissions by 2050, the pending legislation also includes a reduction in GHG emissions to 30% below 2005 levels by 2025 and to 42% below 2005 levels by 2030.[2] The Waste Prevention Rule which was enacted by the Obama Administration in November 2016 to regulate limits on the amount of methane released while drilling for oil and natural gas on federal land was repealed on September 18, 2018.[13][14]
Strategy and measures to address climate change
The U.S. strategy integrates actions to address climate change including actions to mitigate greenhouse gas emissions into a broader agenda that promotes energy security, pollution reduction, and sustainable economic development.
Near-term measures
Energy: residential and commercial sectors
- EPA Clean Energy Programs - Energy Star
- Commercial Building Integration[15] and Residential Building Integration (Build America).[16]
- Weatherization Assistance Program[17]
- State Energy Program[18]
As of 2010, buildings in the United States consume roughly 48% of the country's electricity and contribute a similar percentage of GHG.[19] Engineers Matthias Hollwich and Marc Kushner won the IBM Engineering Innovation award in 2008 with their innovative urban "biogrid" concept called: "MEtreePOLIS–Atlanta in 2018–"the city of the future." By prompting scientists, engineers, and architects in creating new designs and technologies, there is a hope that positive futures will be attainable without causing environmental damages.[20]
Energy: industrial sector
- Energy Star for industry
- Industrial Technologies Program (ITP)[21]
Energy: supply
- Wind Energy[22]
- Solar Energy[23]
- Geothermal Energy[24]
- Biofuels:[25]
- Distributed energy[26]
- EPA Clean Energy Programs - Green Power Partnership[27]
- EPA Clean Energy Programs - Combined Heat and Power Partnership[28]
- Carbon Capture and Storage Research Program[29]
Transportation
As of 2011, 71% of petroleum consumed in the USA was used for transportation.[33]
Programs to reduce greenhouse gas emissions from the transportation sector:
- CAFE:
- The Corporate Average Fuel Economy (CAFE) program requires automobile manufacturers to meet average fuel economy standards for the light-duty vehicle fleet sold in the United States. The passenger car standard has been set by statute at 11.7 kilometers per liter (kpl or km/l) (27.5 miles per gallon (mpg)), but can be amended through rulemaking. In 2003, the National Highway Traffic Safety Administration (NHTSA) raised the standard for minivans, pickup trucks, sport utility vehicles (SUVs), and other light trucks from 8.8 kpl (20.7 mpg) to 8.9 kpl (21.0 mpg) for 2005, 9.2 kpl (21.6 mpg) for 2006, and 9.4 kpl (22.2 mpg) for 2007. The action more than doubles the increase in the standard that occurred between 1986 and 2001, a period of more than 15 years. It is predicted that this activity might save approximately 412 trillion Btus (3.6 billion US gallons (14,000,000 m3)) of gasoline over the life of model year 2005–07 light-truck fleets and is projected to result in emission reductions of 42 Tg of CO 2 Eq. in 2012 for all light trucks after model year 2005.
- In March 2006, NHTSA issued a new rule for light trucks covering model years 2008–11. The new rule raises required light-truck fuel economy to 24 mpg by model year 2011 and will save nearly 1,259 trillion BTUs (11 billion US gallons (42,000,000 m3)) of gasoline (73 Tg of CO 2 Eq.) over the life of the affected vehicles. The new rule includes an innovative reform that varies fuel economy standards according to the size of the vehicle. The regulation has also been extended for the first time to large passenger vans and SUVs.
- Under the Energy Policy Act of 2005, United States Environmental Protection Agency is responsible for promulgating regulations to ensure that gasoline sold in the United States contains a specific volume of renewable fuel. This national Renewable Fuel Standard will increase the volume of renewable fuel that is blended into gasoline, starting with calendar year 2006. The standard is intended to double the amount of renewable fuel usage by 2012. As of 2011, 4% of the energy consumed by transportation was supplied by renewable fuels.[33]
- FreedomCAR and Fuel Partnership and Vehicle Technologies Program:
- The program[34] works jointly with DOE's hydrogen, fuel cell, and infrastructure R&D efforts and the efforts to develop improved technology for hybrid electric vehicle, which include the hybrid electric components (such as batteries and electric motors).
- The U.S. government uses six "criteria pollutants" as indicators of air quality: ozone, carbon monoxide, sulfur dioxide, nitrogen dioxides, particulate matter, and lead and does not include carbon dioxide and other greenhouse gases.
- Clean Cities[35]
- Congestion Mitigation and Air Quality Improvement (CMAQ) Program.[36]
- Aircraft Fuel Efficiency:
- Aviation yields GHG emissions that have the potential to influence global climate. In the United States, aviation makes up about 3% of the national GHG inventory and about 12% of transportation emissions. Currently, measuring and tracking fuel efficiency from aircraft operations provide the data for assessing the improvements in aircraft and engine technology, operational procedures, and the airspace transportation system that reduce aviation's contribution to CO 2 emissions. DOT has a goal to improve aviation fuel efficiency per revenue plane-mile by 1% per year through 2009. In the near term, new technologies to improve air traffic management will help reduce fuel burn and, thus, emissions. In the long term, new engines and aircraft will feature more efficient components and aircraft aerodynamics, enhanced engine cycles, and reduced weight, thereby improving fuel efficiency.
- Biomass and Biorefinery Systems Program[37]
Industry: non-CO2 GHGs
- The United States is one of the first nations to develop and implement a national strategy to control emissions of high-GWP gases. The strategy is a combination of industry partnerships and regulatory mechanisms to minimize atmospheric releases of hydrofluorocarbons (HFCs), perfluorocarbons (PFCs), and sulfur hexafluoride (SF6)—which are potent GHGs that contribute to global warming—while ensuring a safe, rapid, and cost-effective transition away from chlorofluorocarbons (CFCs), hydrochlorofluorocarbons (HCFCs), halons, and other ozone-depleting substances across multiple industry sectors.
- Environmental Stewardship —The objective of this initiative is to limit emissions of HFCs, PFCs, and SF6 in three industrial applications: semiconductor production,49 electric power distribution,50 and magnesium production.
- HFC-23 —To reduce HFC-23 emissions from the manufacture of the ozone-depleting substance HCFC-22.
- Voluntary Aluminum Industry Partnership —To reduce CF4 and C2F6.
- Significant New Alternatives Program (SNAP)- To phase down the use of ozone-depleting substances (ODSs), such as CFCs and HCFCs. SNAP has initiated programs with different industry sectors to monitor and minimize emissions of global-warming gases, such as HFCs and PFCs used as substitutes for ozone-depleting chemicals.
- Mobile Air Conditioning Climate Protection Partnership —
Agriculture
- Environmental Quality Incentives Program
- Conservation Reserve Program
- Conservation Security Program
- AgSTAR
- Renewable Energy Systems and Energy Efficiency Improvements Program
Forestry
Waste management
- Landfill Methane Outreach Program
- Stringent Landfill Rule:
- Promulgated under the Clean Air Act in March 1996, the New Source Performance Standards and Emissions Guidelines ("Landfill Rule") require large landfills to capture and combust their landfill gas emissions. The implementation of the rule began at the state level in 1998. Recent data on the rule's impact indicate that increasing its stringency has significantly increased the number of landfills that must collect and combust their landfill gas. EPA estimates that methane reductions in 2002 were 9 Tg CO2 Eq., and reductions for 2012 may remain about the same.
Cross-sectoral
- Climate VISION (Voluntary Innovative Sector Initiatives: Opportunities Now)
- Voluntary Reporting of Greenhouse Gases Under 1605(b):
- Authorized under Section 1605(b) of the Energy Policy Act of 1992, this voluntary program provides a means for utilities, industries, and other entities to establish a public record of their emissions and the results of voluntary measures to reduce, avoid, or sequester GHG emissions
Nonfederal policies and measures
State initiatives
- Vehicle Air Pollution (SR 27)- States and implies that California Senate does not have to adhere to cutbacks in emissions standards further allowing stricter emissions standards than the federal government for the state of California.[39] Under this senate resolution the current administration or other federal powers will be opposed by California in any reduction or cutback of the Clean Air Act policies that are currently in place; allowing California to have higher emissions and air quality standards. This policy is because of the threat by the current administration's efforts to reverse environmental policies, in this case vehicle emissions standards.[40] This opposition of federal policy changes is allowed through California's Clean Air Act preemption waiver granted to the state by the EPA on July 8, 2009.[41] California's waiver applies to vehicles made in 2009 and later.[41] The current standard being followed by the state is a goal of all vehicles reaching an average of 35 miles per gallon.[Environmental protection Agency Federal Register / Vol. 74, No. 129 / 1][41] California saw a large decline in vehicle emissions from 2007 to 2013 as well as a rise in emissions following 2013 which can be attributed to different circumstances some of which include increased population, increased employment, increase in overall state GDP meaning more productivity in the state. [42]
- Vehicle Registration: Environmental Rebates (SB 745)- Establishes a rebate for any transportation improvement fee on a vehicle. This Senate Bill allots funds from the Greenhouse Gas Reduction Fund to the Climate Policy Special rebate fund and which are then transferred to the department of motor vehicles to pay for newly registered vehicles or renewed vehicles. According to the policy the cost per vehicle is to be displayed in the registration paperwork. [39]
Regional initiatives
- Western Climate Initiative
- As of 2015, the Regional Greenhouse Gas Initiative includes Connecticut, Delaware, Maine, Maryland, Massachusetts, New Hampshire, New York, Rhode Island, and Vermont. It is a cap and trade program in which states "sell nearly all emission allowances through auctions and invest proceeds in energy efficiency, renewable energy and other consumer benefit programs".[43]
- Western Governors Association Clean and Diversified Energy Initiative
- Powering the Plains[44]
- Carbon Sequestration Regional Partnerships[45]
- U.S. Mayors Climate Protection Agreement
- National Governors Association (NGA)´s Securing a Clean Energy Future.[46]
- NGA has announced plans to expand statewide regulations on GHG emissions and clean energy initiatives. In a news conference on September 12, Governors Tim Pawlenty of Minnesota and Kathleen Sebelius of Kansas unveiled a task force they will lead along with six other governors to promote renewable energy, conservation, and a reduction in GHG emissions through statewide policies. The US Department of Energy will provide $610,000 in support for this initiative.
- As chairman of NGA, Governor Tim Pawlenty (R-MN) said that on energy issues, "We have a federal government that doesn't seem to want to move as fast or as bold as many would like." With states creating their own emissions standards, Pawlenty said, there will be a push for the federal government to come up with a nationwide energy policy to address global warming. If enough states act to reduce GHG emissions, it would "become a de facto national policy".[47]
Climate action plans
- Greenhouse gas emissions by California Issued April 2006.
- Connecticut: Issued February 2005
- Massachusetts: Issued May 2004
- New Mexico : Issued December 2006
- Oregon : Issued December 2004[48]
Lead by example programs
Local initiatives
- Cities for Climate Protection Campaign
- Heat Island Reduction Initiative
Private-sector and NGO initiatives
- Climate Savers
- Ceres' Investor Network On Climate Risk
- Green Power Market Development Group
- Chicago Climate Exchange
- Business Environmental Leadership Council
- PowerSwitch!
- Climate RESOLVE
Long-term measures
- Carbon Sequestration Regional Partnerships[45]
- Nuclear:
- Generation IV Nuclear Energy Systems Initiative
- Nuclear Hydrogen Initiative
- Advanced Fuel Cycle Initiative
- Global Nuclear Energy Partnership
- Clean Automotive Technology
- Hydrogen Technology[51]
- and High-temperature superconductivity
International measures
- Kyoto Protocol – signed by U.S. President Bill Clinton in 1998 but never ratified
- Asia Pacific Partnership
Criticism
The British climate envoy in the 2007 meeting of the world's top 16 polluters, John Ashton, said the United States seemed isolated on the issue of fighting climate change: "The argument that we can do this through voluntary approaches is now pretty much discredited internationally".[52]
See also
- Chicago Climate Exchange
- Climate Registry
- Coal in the United States
- Energy conservation in the United States
- Greenhouse gas emissions in Kentucky
- List of countries by carbon dioxide emissions
- List of U.S. states by carbon dioxide emissions
- Politics of global warming
- Post–Kyoto Protocol negotiations on greenhouse gas emissions
- Regulation of Greenhouse Gases Under the Clean Air Act
- Select Committee on Energy Independence and Global Warming
- U.S. Climate Change Science Program
Notes
References
- ↑ EPA,OA, US. "Sources of Greenhouse Gas Emissions - US EPA". US EPA. Retrieved 19 April 2018.
- 1 2 http://apps1.eere.energy.gov/news/news_detail.cfm/news_id=15650 December 02, 2009 President Obama Sets a Target for Cutting U.S. Greenhouse Gas Emissions
- ↑ "US methane emissions are drastically underestimated, a new study shows". PRI. 2016.
- ↑ "EIA - Emissions of Greenhouse Gases in the U.S. 2006-Carbon Dioxide Emissions". doe.gov. Retrieved 19 April 2018.
- ↑ Benson, Eric; Napier, Pamela (2012). "Connecting Values: Teaching Sustainability to Communication Designers". Design and Culture. 4 (2).
- ↑ Kinsella, S. (2007). "The State of the Paper Industry Monitoring the Indicators of Environmental Performance". Environmental Paper Network.
- ↑ Mortenson, L. (2001). "Environment". OECD Environmental Outlook.
- ↑ "Facts about Climate Change Science and Ocean Acidification, truth from consensus and climate change skeptics". www.climatechangefacts.info. Retrieved 19 April 2018.
- ↑ "Carbon Tax Effectiveness". www.carbontax.org. Retrieved 19 April 2018.
- ↑ "Carbon Footprint Factsheet - Center for Sustainable Systems". css.umich.edu. Retrieved 19 April 2018.
- ↑ EPA,OEI, US. "Page being updated" (PDF). www.epa.gov. Retrieved 19 April 2018.
- ↑ Gurney, Kevin. "The Vulcan Project - Index". vulcan.project.asu.edu. Retrieved 19 April 2018.
- ↑ https://www.bloomberg.com/news/articles/2018-09-18/trump-relaxes-obama-curbs-on-flaring-gas-from-wells-on-u-s-land
- ↑ https://www.spglobal.com/platts/en/market-insights/latest-news/oil/091818-us-interior-finalizes-changes-to-federal-lands-methane-rule
- ↑ DOE: High Performance Buildings
- ↑ Building Technologies Program: Building America
- ↑ http://www.eere.energy.gov/weatherization
- ↑ EERE: State Energy Program Home Page
- ↑ Mazria, Ed. "2030 Challenge". Archived from the original on 2009-12-24.
- ↑ Cogdell, Christina (2011). "Tearing Down the Grid". Design and Culture. 3 (1).
- ↑ Industrial Technologies Program BestPractices
- ↑ Wind and Hydropower Technologies Program: Wind Energy Research
- ↑ "Office of Energy Efficiency & Renewable Energy | Department of Energy". Eere.energy.gov. Retrieved 2018-07-11.
- ↑ EERE: Geothermal Technologies Program Home Page
- ↑ EERE: Biomass Program Home Page
- ↑ OE: Distributed Energy Program Home Page
- ↑ "Green Power Partnership". www.epa.gov. U.S. Environmental Protection Agency. Retrieved 28 July 2014.
- ↑ "Combined Heat and Power Partnership". www.epa.gov. U.S. Environmental Protection Agency. Retrieved 28 July 2014.
- ↑ "Carbon Capture and Storage Research". Energy.gov. U.S. Department of Energy, Office of Fossil Energy. Retrieved 28 July 2014.
- ↑ "Advanced Energy Systems Program". NETL website. National Energy Technology Laboratory, U.S. Department of Energy. Retrieved 28 July 2014.
- ↑ "Carbon Capture". NETL website. National Energy Technology Laboratory, U.S. Department of Energy. Retrieved 28 July 2014.
- ↑ "Carbon Storage Technology". NETL website. National Energy Technology Laboratory, U.S. Department of Energy. Retrieved 28 July 2014.
- 1 2 US Energy Information Administration, Primary energy by source and sector, 2011, PDF.
- ↑ EERE: Vehicle Technologies Program Home Page
- ↑ EERE: Clean Cities Home Page Archived 2007-04-27 at the Wayback Machine.
- ↑ "CMAQ - Air Quality - Environment - FHWA". www.fhwa.dot.gov. Retrieved 19 April 2018.
- ↑ EERE: Biomass Program Home Page
- ↑ "US EPA - Methane". epa.gov. Retrieved 19 April 2018.
- 1 2 Board, California Air Resources. "Air Quality Legislation". www.arb.ca.gov. Retrieved 2018-09-07.
- ↑ "California Senate approves Wieckowski Clean Air Act resolution". Senator Bob Wieckowski. 2017-04-03. Retrieved 2018-09-07.
- 1 2 3 EPA,OAR,OTAQ, US. "California Greenhouse Gas Waiver Request | US EPA". US EPA. Retrieved 2018-09-07.
- ↑ "California's Greenhouse Gas Emission Inventory". www.arb.ca.gov. Retrieved 2018-09-07.
- ↑ "Welcome". Regional Greenhouse Gas Initiative, Inc. n.d. Retrieved 9 February 2015.
- ↑ "Powering the Plains: Energy Transition Roadmap" (PDF). GPI website. Great Plains Institute. Retrieved 28 July 2014.
- 1 2 "Regional Carbon Sequestration Partnerships". NETL website. National Energy Technology Laboratory, U.S. Department of Energy. Retrieved 28 July 2014.
- ↑ National Governors Association Archived 2007-10-27 at the Wayback Machine.
- ↑ https://www.washingtonpost.com/wp-dyn/content/article/2007/09/12/AR2007091201651.html?tid=informbox , "Archived copy". Archived from the original on 2007-10-27. Retrieved 2007-09-17.
- ↑ The Governor's Advisory Group on Global Warming (2004-12-17). "Climate Change in Oregon - Oregon Strategy". Oregon Department of Energy. Archived from the original on 2010-04-04. Retrieved 2010-03-04.
- ↑ Jay, Kate (November 14, 2008). "First Carbon Neutral Zone Created in the United States". Reuters. Archived from the original on September 7, 2009.
- ↑ Auchmutey, Jim (January 26, 2009). "Trying on carbon-neutral trend". Atlanta Journal-Constitution.
- ↑ "Technologies for Hydrogen Production". Gasifipedia. National Energy Technology Laboratory, U.S. Department of Energy. Retrieved 28 July 2014.
- ↑ "Bush climate plans spark debate". BBC News. 2007-09-29. Retrieved 2010-05-04.
External links
| Wikisource has original text related to this article: |
- http://www.eere.energy.gov/news/enn.cfm#energy
- U.S. Emissions Data and total carbon dioxide emissions from the consumption and flaring of fossil fuels data (Energy Information Administration).
- United States Environmental Protection Agency (EPA) Economic analysis:
- New High-Res Map of U.S. Per-Capita CO2 Emissions.
- Georgia Judge Cites Carbon Dioxide in Denying Coal Plant Permit.
- [32] 2005 Energy CO2 Emissions by State and Industrial Sector for Fossil Fuel Combustion (EPA)
- Project Vulcan high resolution fossil fuel CO2 inventory for the United States
- EPA Standards for Greenhouse Gas Emissions from Power Plants: Many Questions, Some Answers Congressional Research Service
Greenhouse gas emissions by the Americas | ||
|---|---|---|
| ||
| Sovereign states |
| .svg.png) |
| ||