Duck curve
|
|
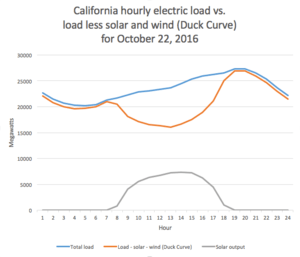
In commercial-scale electricity generation, the duck curve is a graph of power production over the course of a day that shows the timing imbalance between peak demand and renewable energy production. In many energy markets the peak demand occurs after sunset, when solar power is no longer available. In locations where a substantial amount of solar electric capacity has been installed, the amount of power that must be generated from sources other than solar or wind displays a rapid increase around sunset and peaks in the mid-evening hours, producing a graph that resembles the silhouette of a duck.[2][3] In Hawaii, significant adoption of solar generation has led to the more pronounced curve known as the Nessie curve.[4][5]
Without any form of energy storage, after times of high solar generation generating companies must rapidly increase power output around the time of sunset to compensate for the loss of solar generation, a major concern for grid operators where there is rapid growth of photovoltaics.[6] Storage can fix these issues if it can be implemented. Flywheels have shown to provide excellent frequency regulation.[7] Short term use batteries, at a large enough scale of use, can help to flatten the duck curve and prevent generator use fluctuation and can help to maintain voltage profile.[8] However, cost is a major limiting factor for energy storage as each technique is expensive to produce at scale and comparatively not energy dense compared to liquid fossil fuels.
The term was coined in 2008 by the National Renewable Energy Laboratory.[9]
Mitigation strategies
Methods for coping with the rapid increase in demand at sunset reflected in the duck curve, which becomes more serious as the penetration of solar generation grows, include:[8]
- Installing more dispatchable generation
- Orienting some solar collectors toward the west to maximize generation near sunset.
- Energy storage including:
- Pumped-storage hydroelectricity
- Battery storage power stations
- Solar thermal energy with thermal energy storage
- Ice storage air conditioning
- Use of batteries in electric vehicles for temporary storage (vehicle-to-grid)
- Energy demand management, including:
- Transitioning to more efficient lighting systems, such as compact fluorescent and LED lighting
- time-of-use pricing (TOU) and real-time pricing
- Smart grid technology
A major challenge is deploying mitigating capacity at a rate that keeps up with the growth of solar energy production. The effects of the duck curve have happened faster than anticipated.[10]
Duck curve in California
The California Independent System Operator (CAISO) has been monitoring and analyzing the Duck Curve and its future expectations for about a half a century now and their biggest finding is the growing gap between morning and evening hours prices relative to midday hours prices.[1] According to their last study, the U.S. Energy Information Administration, found that the wholesale energy market prices over the past six months during the 5 p.m. to 8 p.m. period (the “neck” of the duck) have increased to $60 per megawatt-hour, compared to about $35 per megawatt-hour in the same time frame in 2016.[2] However, on the other side they have measured a drastic decrease in the midday prices, nearing $15 per megawatt-hour.[2] These high peaks and deep valleys are only showing continues trends of going further apart making this Duck Curve even more prevalent as our renewable energy production continues to grow.[3]
A crucial part of this curve comes from the Net Load ("the difference between expected load and anticipated electricity production from the range of renewable energy sources").[2] In certain times of the year (namely Spring and Summer), the curves create a “belly” appearance in the midday that then drastically increases portraying an “arch” similar to the neck of a duck, consequently the name “The Duck Chart.[11]” During the midday, large amounts of solar energy is created and partially contributes to lower demand for additional electricity.[12] Increasing battery storage can mitigate the issues of solar abundance during the day. When excess solar energy is stored during the day and used in the evening, the price disparity between inexpensive midday and expensive evening energy can be reduced. Enough total solar technology exists to power the world, but there is a current lack of infrastructure to store solar energy for later use.[6] An oversupply of energy during low demand coupled with a lack of supply during high demand explains the large disparity between midday and evening energy prices.
To understand these deep valleys and the high peaks we need to look at many different variables that go into the renewable energy grid. The green resources such as solar, wind, geothermal, and hydroelectric are increasingly satisfying California’s total electricity needs.[4] Green energy is abundant, which has become an economic issue on the time of use front.[6] However, as of now, the technology that has been implemented puts a lot of control into consumers which leads to issues amongst different operating conditions.[6] In order for it to run smoothly this would require flexible resource potentials to guarantee reliability from the renewable energy grid.[1] The idea of reliability is one of the biggest issues facing the green energy market. Intermittency (“occurring at irregular intervals; not continuous or steady”) can lead to skepticism in consumers.[13] If consumers are to transfer energy into the renewable grid, they must be guaranteed a constant stream of energy at a price/rate that can be maintained, but the Duck Curve issue is proving just the opposite.[2]
References
- 1 2 3 "California ISO - Renewables Reporting". www.caiso.com.
- 1 2 3 4 5 Paul Denholm, Matthew O’Connell, Gregory Brinkman, and Jennie Jorgenson. "Overgeneration from Solar Energy in California: A Field Guide to the Duck Chart" NREL/TP-6A20-65023. National Renewable Energy Laboratory, November 2015
- 1 2 Wirfs-Brock, Jordan (2 October 2014). "IE Questions: Why Is California Trying To Behead The Duck?". Inside Energy. Retrieved 29 October 2016.
- 1 2 "Charting Hawaii's Spectacular Solar Growth". The Energy Collective. Retrieved 2015-02-04.
- ↑ "Hawaii's Solar-Grid Landscape and the 'Nessie Curve'". 10 February 2014. Retrieved 10 January 2017.
- 1 2 3 4 "What the Duck Curve Tells Us About Managing A Green Grid" (PDF). caiso.com. California ISO. Retrieved 29 April 2015.
- ↑ Lazarewicz, Matthew; Rojas, Alex (10 June 2004). "Grid Frequency Regulation by Recycling Electrical Energy in Flywheels". Power Engineering Society General Meeting: 2038–2042. Retrieved 29 April 2015.
- 1 2 Lazar, Jim. "Teaching the "Duck" to Fly" (PDF). RAP. Retrieved 29 April 2015.
- ↑ Roberts, David (20 March 2018). "Solar power's greatest challenge was discovered 10 years ago. It looks like a duck". Vox. Retrieved 20 March 2018.
- ↑ "The California Duck Curve Is Real, and Bigger Than Expected". 3 November 2016. Retrieved 10 January 2017.
- ↑ "EIA Data Reveals California's Real and Growing Duck Curve". Retrieved 2017-12-01.
- ↑ "A world turned upside down". The Economist. Retrieved 2017-12-01.
- ↑ "Intermittent energy source". Wikipedia. 2017-12-01.