Solar power in the United States
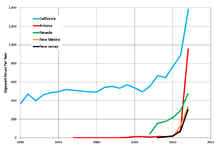
Solar power in the United States includes utility-scale solar power plants as well as local distributed generation, mostly from rooftop photovoltaics. As of the end of 2017, the United States had over 50 gigawatts (GW) of installed photovoltaic capacity. [1] In the twelve months through May 2018, utility scale and distributed solar power generated 58.9 terawatt-hours (TWh), 1.44% of total U.S. electricity. During the same time period total solar generation, including estimated distributed solar photovoltaic generation, was 85.4 TWh, 2.09% of total U.S. electricity.[2] In terms of total cumulative installed capacity, by year end 2017 the United States ranked 2nd in the world behind China. In 2016, 39% of all new electricity generation capacity in the country came from solar, more than any other source and ahead of natural gas (29%).[3] By 2015, solar employment had overtaken oil and gas as well as coal employment in the United States.[4] In 2016, more than 260,000 Americans were employed in the solar industry.[5]
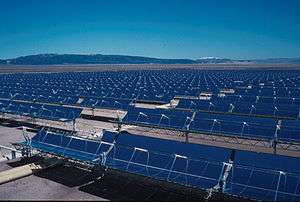
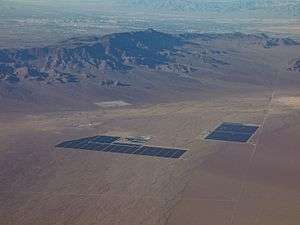
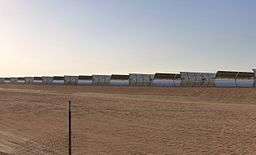
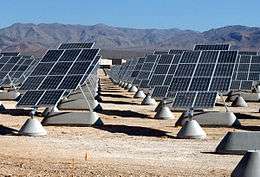
The United States conducted much early research in photovoltaics and concentrated solar power. It is among the top countries in the world in electricity generated by the Sun and several of the world's largest utility-scale installations are located in the desert Southwest. The oldest solar power plant in the world is the 354-megawatt (MW) SEGS thermal power plant, in California.[6] The Ivanpah Solar Electric Generating System is a solar thermal power project in the California Mojave Desert, 40 miles (64 km) southwest of Las Vegas, with a gross capacity of 392 MW.[7] The 280 MW Solana Generating Station is a solar power plant near Gila Bend, Arizona, about 70 miles (110 km) southwest of Phoenix, completed in 2013. When commissioned it was the largest parabolic trough plant in the world and the first U.S. solar plant with molten salt thermal energy storage.[8]
There are plans to build many other large solar plants in the United States. Many states have set individual renewable energy goals with solar power being included in various proportions. Governor Jerry Brown has signed legislation requiring California's utilities to obtain 50 percent of their electricity from renewable energy sources by the end of 2030.[9]
Solar potential
A 1998 report by the United States Department of Energy found available domestic solar energy (including biomass) technically accessible regardless of cost amounted to 586,687 Quadrillion BTUs (Quads); 95% of this was biomass. Coal represented the second largest resource, a distant 38,147 Quads. Predictions of how much solar power was economically feasible to collect amounted to 352 quads, compared with 5,266 quads from coal. The assumptions used in the report were based on a predicted 2010 price of a barrel of oil being $38, and multiplied annual renewable resources by 30 for comparison with non-renewable resources.[10] The total annual energy consumption of the United States in 2007 was approximately 100 Quads,[11] less than 0.5% of what is theoretically available from sunlight.
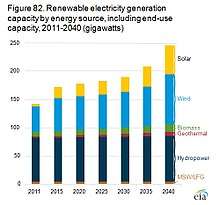
A 2012 report from the National Renewable Energy Laboratory (NREL) described technically available renewable energy resources for each state and estimated that urban utility scale photovoltaics could supply 2,232 TWh/year, rural utility scale PV 280,613 TWh/year, rooftop PV 818 TWh/year, and CSP 116,146 TWh/year, for a total of almost 400,000 TWh/year, 100 times current consumption of 3,856 TWh in 2011.[12][13] For comparison, onshore wind potential is estimated at 32,784 TWh/year, and offshore wind at 16,976 TWh/year, while the total available from all renewable resources is estimated at 481,963 TWh/year.[14]
Growth
Solar energy deployment increased at a record pace in the United States and throughout the world in 2008, according to industry reports. The Solar Energy Industries Association's "2008 U.S. Solar Industry Year in Review" found that U.S. solar energy capacity increased by 17% in 2007, reaching the total equivalent of 8,775 megawatts (MW). The SEIA report tallies all types of solar energy, and in 2007 the United States installed 342 MW of solar photovoltaic (PV) electric power, 139 thermal megawatts (MWth) of solar water heating, 762 MWth of pool heating, and 21 MWth of solar space heating and cooling.[15]
A report by research and publishing firm Clean Edge and the nonprofit Co-op America found that solar power's contribution could grow to 10% of the nation's power needs by 2025, with nearly 2% of the nation's electricity coming from concentrating solar power systems, while solar photovoltaic systems would provide more than 8% of the nation's electricity. Those figures correlate to nearly 50,000 megawatts of solar photovoltaic systems and more than 6,600 megawatts of concentrating solar power.[16] The report notes that the cost per kilowatt-hour of solar photovoltaic systems has been dropping, while electricity generated from fossil fuels is becoming more expensive. As a result, the report projects that solar power will reach cost parity with conventional power sources in many U.S. markets by 2015. To reach the 10% goal, solar photovoltaic companies would need to make solar power a "plug-and-play technology", or simplify the deployment of solar systems.[16] The report also underlines the importance of future "smart grid" technologies.[16]
According to a study by the Solar Energy Industries Association and GTM Research, 878 megawatts (MW) of photovoltaic (PV) capacity and 78 MW of concentrating solar power (CSP) were installed in the U.S. in 2010, enough to power roughly 200,000 homes. In addition, more than 65,000 homes and businesses added solar water heating (SWH) or solar pool heating (SPH) systems. This was double the 435 MW installed in 2009 around the U.S.[17]
According to a 2011 survey conducted by independent polling firm Kelton Research, nine out of 10 Americans support the use and development of solar technology. Eight out of 10 respondents indicated that "the federal government should support solar manufacturing in the United States and should give federal subsidies for solar energy".[18] According to the Energy Information Administration, in fiscal year 2013, federal supports and subsidies for solar power amounted to $4.4 billion, over 27% of all federal supports and subsidies for electricity production. This figure does not include state and local spending.[19]
Solar Energy Industries Association and GTM Research found that the amount of new solar electric capacity increased in 2012 by 76 percent from 2011, raising the United States’ market share of the world’s installations above 10 percent, up from roughly 5 to 7 percent in the last seven years.[20] According to the U.S. Energy Information Administration, as of September 2014 utility-scale solar had sent 12,303 gigawatt-hours of electricity to the U.S. grid. This was an increase of over 100% versus the same period in 2013 (6,048 GWh).[21] The number of homes with solar systems installed has been increasing rapidly; from 30,000 in 2006 to 1.3 million in 2016[22] with a study by the U.S. Department of Energy predicting the figure could reach 3,800,000 homes by 2020.[23]
Utilities in the United States have led a largely unsuccessful campaign to slow the growth of solar.[24]
Concentrated solar power (CSP)
History
One of the first applications of concentrated solar was the 6 hp solar powered motor made by H.E. Willsie and John Boyle in 1904.[25]
An early solar pioneer of the 19th and 20th century, Frank Shuman, built a demonstration plant that used solar power to pump water using an array of mirrors in a trough to generate steam. Located in Philadelphia, the solar water pump station was capable of pumping 3000 gallons an hour (25 hp)[26] at that latitude. After seven weeks of testing the plant was disassembled and shipped to Egypt for testing as an irrigation plant.[27]
In 1973, Karl Böer of the University of Delaware built an experimental house called the Solar One, the first house to convert sunlight into energy.[28]
Solar One, the first pilot solar power tower design was completed in 1981. The parabolic trough Solar Energy Generating Systems opened its first unit in 1984, the first major solar thermal plant in the world.
Selected list of plants
.jpg)
The United States pioneered solar tower and trough technologies. A number of different solar thermal technologies are in use in the U.S:
- The largest solar thermal power plant in the world is the 392 MW Ivanpah Solar Power Facility, in California. It deploys 173,500 heliostats each with two mirrors focusing solar energy on boilers located on centralized solar power towers. The facility opened on February 13, 2014.[29]
- The Solana Generating Station is a solar power plant near Gila Bend, Arizona, about 70 miles (110 km) southwest of Phoenix, completed in 2013. When commissioned it was the largest parabolic trough plant in the world and the first U.S. solar plant with molten salt thermal energy storage.[8] Built by the Spanish company Abengoa Solar,[30] it has a total capacity of 280 megawatts (MW),[30] which is enough to power 70,000 homes while avoiding around 475,000 tons of carbon dioxide.[30] Its name is the Spanish term for "sunny spot".[31]
- The Martin Next Generation Solar Energy Center is a hybrid 75 megawatt (MW) parabolic trough solar energy plant that is owned by Florida Power & Light Company (FPL). The solar plant is a component of the 3,705 MW Martin County Power Plant, which is currently the single largest fossil fuel burning power plant in the United States.[32] Completed at the end of 2010,[33] it is located in western Martin County, Florida, just north of Indiantown.
- The Mojave Solar Project is a 280 MW solar thermal power facility in the Mojave Desert in California, which was completed in December 2014.
- The Crescent Dunes Solar Energy Project is a 110 MW solar thermal power project near Tonopah, about 230 miles (370 km) northwest of Las Vegas, which was completed in September 2015.[34][35]
The rapidly falling price of PV solar had led to several projects being abandoned or converted to PV technology.[36] Blythe Solar Power Project converted to a PV project, Rice Solar Energy Project was put on indefinite hold, Palen Solar Project tried to convert to PV but its permits were denied, Hidden Hills Solar Project was suspended in 2013 and later canceled.[37][38] No major CSP plants remain under construction in the United States.
CSP capacity and generation
Abengoa's 280 MWac of CSP project was brought online in the 3rd quarter and Genesis Solar's first phase of 125 MWac was brought online in the 4th quarter of 2013 bringing the total to 410 MWac for the year and 918 MWac total. Ivanpah is already completed during the first quarter of 2014 the current world's largest CSP power plant is 392 MWac and brings the total to 1310 MWac. The 110 MWac Crescent Dunes project started commissioning during February. The 250 MWac Mojave solar, second phase 125 MWac Genesis Solar, and Tooele Army Depot Solar's 1.5 MWac power plant are all expected to come online in 2014.[39] The A total of around 9.5 GW of solar PV and CSP capacity is expected to come on-line in 2016, more than any other source.[40]
| United States | California | Arizona | Florida | Nevada | Colorado | New Mexico | Hawaii | |
|---|---|---|---|---|---|---|---|---|
| 1982 | 10 | 10 | 0 | 0 | 0 | 0 | 0 | 0 |
| 1983 | 10 | 10 | 0 | 0 | 0 | 0 | 0 | 0 |
| 1984 | 10 | 10 | 0 | 0 | 0 | 0 | 0 | 0 |
| 1985 | 24 | 24 | 0 | 0 | 0 | 0 | 0 | 0 |
| 1986 | 54 | 54 | 0 | 0 | 0 | 0 | 0 | 0 |
| 1987 | 114 | 114 | 0 | 0 | 0 | 0 | 0 | 0 |
| 1988 | 144 | 144 | 0 | 0 | 0 | 0 | 0 | 0 |
| 1989 | 204 | 204 | 0 | 0 | 0 | 0 | 0 | 0 |
| 1990 | 284 | 284 | 0 | 0 | 0 | 0 | 0 | 0 |
| 1991 | 364 | 364 | 0 | 0 | 0 | 0 | 0 | 0 |
| 1992 | 364 | 364 | 0 | 0 | 0 | 0 | 0 | 0 |
| 1993 | 364 | 364 | 0 | 0 | 0 | 0 | 0 | 0 |
| 1994 | 364 | 364 | 0 | 0 | 0 | 0 | 0 | 0 |
| 1995 | 364 | 364 | 0 | 0 | 0 | 0 | 0 | 0 |
| 1996 | 364 | 364 | 0 | 0 | 0 | 0 | 0 | 0 |
| 1997 | 364 | 364 | 0 | 0 | 0 | 0 | 0 | 0 |
| 1998 | 364 | 364 | 0 | 0 | 0 | 0 | 0 | 0 |
| 1999 | 354 | 354 | 0 | 0 | 0 | 0 | 0 | 0 |
| 2000 | 354 | 354 | 0 | 0 | 0 | 0 | 0 | 0 |
| 2001 | 354 | 354 | 0 | 0 | 0 | 0 | 0 | 0 |
| 2002 | 354 | 354 | 0 | 0 | 0 | 0 | 0 | 0 |
| 2003 | 354 | 354 | 0 | 0 | 0 | 0 | 0 | 0 |
| 2004 | 354 | 354 | 0 | 0 | 0 | 0 | 0 | 0 |
| 2005 | 354 | 354 | 1 | 0 | 0 | 0 | 0 | 0 |
| 2006 | 355 | 354 | 1 | 0 | 0 | 0 | 0 | 0 |
| 2007 | 419 | 354 | 1 | 0 | 64 | 0 | 0 | 0 |
| 2008 | 419 | 354 | 1 | 0 | 64 | 0 | 0 | 0 |
| 2009 | 430 | 364 | 1 | 0 | 64 | 0 | 0 | 0.8 |
| 2010 | 507 | 364 | 2.5 | 75 | 64 | 1 | 0 | 0.8 |
| 2011 | 516 | 364.5 | 4.8 | 75 | 64 | 2.4 | 6 | 0.8 |
| 2012 | 546 | 364.5 | 3.7 | 75 | 64 | 31.8 | 6 | 0.8 |
| 2013 | 918 | 489.5 | 283.7 | 75 | 64 | 31.8 | 6 | 0.8 |
| 2014 | 2,200 | 1256.5 | 283.7 | 75 | 64 | 31.8 | 6 | 0.8 |
| 2015 | 2,310 | 1256.5 | 283.7 | 75 | 174 | 31.8 | 6 | 0.8 |
| Year | Summer capacity (GW) |
Electricity generation (TWh) |
Capacity factor | Yearly growth of generating capacity |
Yearly growth of produced energy |
Portion of renewable electricity |
Portion of total electricity |
|---|---|---|---|---|---|---|---|
| 2017 | 1.76 | 3.40 | 0.220 | 0% | 0.5% | 0.50% | 0.08% |
| 2016 | 1.76 | 3.384 | 0.220 | 0% | 5% | 0.56% | 0.08% |
| 2015 | 1.76 | 3.227 | 0.210 | 5.4% | 32.0% | 0.60% | 0.09% |
| 2014 | 1.66 | 2.446 | 0.168 | 28.68% | 164.15% | 0.45% | 0.06% |
| 2013 | 1.29 | 0.926 | 0.082 | 171.01% | 5.71% | 0.18% | 0.02% |
| 2012 | 0.476 | 0.876 | 0.210 | 1.06% | 8.68% | 0.18% | 0.02% |
| 2011 | 0.471 | 0.806 | 0.195 | 2.15% | 0.16% | 0.02% | |
| 2010 | 0.789 | 0.245 | 7.35% | 0.18% | 0.02% | ||
| 2009 | 0.735 | 0.236 | -6.73% | 0.18% | 0.02% | ||
| 2008 | 0.788 | 0.195 | 32.21% | 0.21% | 0.02% | ||
| 2007 | 0.596 | 20.89% | 0.17% | 0.01% | |||
| 2006 | 0.493 | -7.85% | 0.13% | 0.01% | |||
| 2005 | 0.535 | -5.98% | 0.15% | 0.01% | |||
| 2004 | 0.569 | 0.16% | 0.01% |
Solar photovoltaic power
Solar cell manufacturing

In late September 2008, Sanyo Electric Company, Ltd. announced its decision to build a manufacturing plant for solar ingots and wafers (the building blocks for silicon solar cells) in Salem, Oregon. The plant was scheduled to begin operating in October 2009 and scheduled to reach its full production capacity of 70 megawatts (MW) of solar wafers per year by April 2010. In April 2013 the plant closed its wafer slicing operation. In February 2016 the parent company, Panasonic, announced it would lay off 37% of the remaining workforce.[50] In early October 2008, First Solar, Inc. broke ground on an expansion of its Perrysburg, Ohio, planned to add enough capacity to produce another 57 MW per year of solar modules at the facility, bringing its total capacity to roughly 192 MW per year. In November 2016 the company reduced the workforce in the Perrysburg plant by 20% as part of a worldwide restructuring.[51] In mid-October 2008, SolarWorld AG opened a manufacturing plant in Hillsboro, Oregon. In 2016 the Hillsboro plant was the largest photovoltaic technology manufacturing plant in the Western Hemisphere. It maintains 500 megawatts of cell-manufacturing capacity and 350 MW of module-assembly capacity.[52]
Rapidly decreasing photovoltaic prices put General Electric's planned factory in Colorado on hold,[53] and led to the bankruptcy of Konarka Technologies, which had expected to produce 1,000 MW of solar modules per year by 2011, and Solyndra, which defaulted on a $535 million loan guarantee, prompting Republican members of the Energy and Commerce committee to vote to cease accepting new applications to the loan program. HelioVolt Corporation opened a manufacturing facility in Austin, Texas that will have an initial capacity to produce 20 MW of solar cells per year. Starting with solar "inks" developed at DOE's National Renewable Energy Laboratory that are deposited with ink jets, HelioVolt employs a proprietary "printing" process to produce solar cells consisting of thin films of copper indium gallium selenide, or CIGS. The technology won an R&D 100 Award in 2008 and it earned an Editor's Choice Award for Most Revolutionary Technology. HelioVolt's "FASST" reactive transfer printing process is 10–100 times faster than other CIGS production processes and can also be combined with vacuum evaporation or ultrasonic spray deposition techniques. At its new Austin manufacturing plant, HelioVolt plans to produce both solar modules and next-generation building-integrated solar products using its FASST process.
In 2012 the U.S. Department of Commerce placed a 31% tariff on solar cells made in China.[54] In 2018, the Trump administration placed a 30% tariff on all imported solar equipment.[55]
In September 2014, SolarCity broke ground on a solar panel manufacturing plant in Buffalo, New York. Upon its completion in 2016, it is estimated it will be the largest solar manufacturing facility in the Western hemisphere, with an annual manufacturing capacity of 1 gigawatt (GW).[56]
Large-scale PV facilities
The ten largest solar PV plants in the United States are:
- The 579 megawatt Solar Star project in California was the world's largest photovoltaic power station when completed in 2015. It was superseded later that year by the Longyangxia Dam Solar Park in China.
- The Topaz Solar Farm is a 550 MW photovoltaic power plant in San Luis Obispo County, California and fully operational since November 2014.[57]
- The Copper Mountain Solar Facility is a 552MW solar power plant in Boulder City, Nevada.[58] Sempra Generation constructed the plant in 2010. At its construction peak more than 350 workers were installing the 775,000 First Solar panels on the 380-acre (1.5 km2) site.[58][59][60]
- The Desert Sunlight Solar Farm is a 550 MW solar power station located in the Sonoran Desert of California; completed in January 2015.[61]
- The 400MW Mesquite Solar project in Arizona still being expanded in 2017.
- The Springbok Solar Farm is a 328MW solar farm in 2016 in California.
- The 300MW Stateline Solar built in 2016 in California.
- The Agua Caliente Solar Project is a 289 megawatt photovoltaic solar generating facility in Yuma County, Arizona.[62][63]
- The 266 MW Antelope Valley Solar Ranch is a First Solar photovoltaic project in the Antelope Valley area of the Western Mojave Desert, completed in 2013.[64][65]
- The 266 MW Mount Signal Solar was completed in May 2014. It was built in southern California near the Mexican border.[66]
Planned PV plants
Over 30 GW of utility-scale photovoltaic power plants were under development in the United States in 2015.[67] The largest is the 2,700 MW Westlands Solar Park, in Kings County, California.[68] The Blythe Solar Power Project is a 485 MW photovoltaic station under construction in Riverside County, California. The 300 MW Sonoran Solar Project in Arizona, is a photovoltaic solar power plant that is being planned by a subsidiary of NextEra Energy Resources. Secretary of the Interior Ken Salazar granted approval for the project in December 2011.[69]
SolarStrong is SolarCity's five-year plan to build more than $1 billion in solar photovoltaic projects for privatized military housing communities across the United States. SolarCity plans to work with the country's leading privatized military housing developers to install, own and operate rooftop solar installations and provide solar electricity at a lower cost than utility power. SolarStrong is ultimately expected to create up to 300 megawatts of solar generation capacity that could provide power to as many as 120,000 military housing units, making it the largest residential photovoltaic project in American history. In November 2011, SolarCity and Bank of America Merrill Lynch announced that they have agreed to terms on financing for SolarStrong.[70]
2012 priority proposals
In 2012, the Bureau of Land Management is giving priority status to 9 PV project proposals.[71] The 750 MW McCoy Solar Project has been proposed by NextEra. The 100 MW Desert Harvest project has been proposed by enXco. The 664 Calico Solar Project has been redesigned by K Power. The 350 MW Silver State South and 350 MW Moapa project have been proposed. The 600 MW Mount Signal Solar Farm #1 has also been proposed.[71]
Prior to 2012, in six southwestern states (Arizona, California, Colorado, Nevada, New Mexico, and Utah) the U.S. Bureau of Land Management owned nearly 98 million acres (an area larger than the state of Montana) that was open to proposals for solar power installations. To streamline consideration of applications, the BLM produced a Programmatic Environmental Impact Statement (PEIS). By the subsequent Record of Decision in October 2012, the BLM withdrew 78 percent of its land from possible solar development, leaving 19 million acres still open to applications for solar installations, an area nearly as large as South Carolina. Of the area left open to solar proposals, the BLM has identified 285 thousand acres in 17 highly favorable areas it calls Solar Energy Zones.[72][73][74]
- Arizona
- Brenda 3,865 acres (345–620 MW)
- Gillespie 2,618 acres (233–419 MW)
- California
- Imperial East 5,717 acres (509–916 MW)
- Riverside East 147,910 acres (18,035–32,463 MW)
- Colorado
- Antonito Southeast 9,712 acres (865–1,557 MW)
- De Tilla Gulch 1,064 acres (135–243 MW)
- Fourmile East 2,882 acres (345–621 MW)
- Los Mogotes East 4,734 acres (526–947 MW)
- Nevada
- Amargosa Valley 8,479 acres (2,811–5,060 MW)
- Dry Lake 5,717 acres (1,391–2,504 MW)
- Dry Lake Valley North 25,069 acres (6,833–12,300 MW)
- Gold Point 4,596 acres (428–770 MW)
- Millers 16,534 acres (1,492–2,686 MW)
- New Mexico
- Afton 29,964 acres (6,900–12,400 MW)
- Utah
- Escalante Valley 6,533 acres (588–1,058 MW)
- Milford Flats South 6,252 acres (576–1,037 MW)
- Wah Wah Valley 5,873 acres (542–976 MW)
Total: 42,554–76,577 MW, depending on the technology used
Distributed generation
Within the cumulative PV capacity in the United States, there has been growth in the distributed generation segment, which are all grid-connected PV installations in the residential and non-residential markets. Non-residential market includes installations on commercial, government, school and non-profit organization properties. Between 2000 and 2013 there had been 2,261 MW of residential solar and 4,051 MW non-residential solar installed. In 2013, there were 1,913 MW installed for these markets; the top 5 states were California, New Jersey, Massachusetts, Hawaii, and Arizona. The residential market had 60% annual growth in 2013. The growth contributing factors were new marketing strategies to partner with retailers to reach more customers, and new financial models including the securitization of residential solar assets. Non-residential PV had a slight growth of 4% in 2013 as the market was recovering from the oversupply in 2012. The future growth will likely come from New York, Arizona, and Colorado.[75]
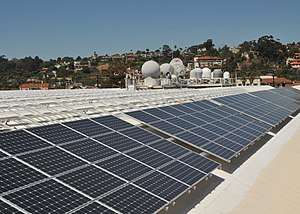
One of the largest residential solar projects was a 115 kilowatt system on a property in Southern California in 2011.[76] There were many large scale non-residential installations. One of the largest rooftop installations for commercial properties was the 9 MW system of Holt Logistics refrigerated warehouse at the Gloucester Marine Terminal in New Jersey.[77] One of the large scale PV installations in schools was the solar project of San Diego Unified School District with total of 48 sites and aggregated installed capacity of 9.17 MW.[78]
Another type of distributed generation implemented by utility company is the world's first grid-connected pole-attached solar panels of Public Service Enterprise Group in New Jersey. More than 174,000 PV panels are mounted on utility poles along streets of New Jersey with aggregated capacity of 40 MW.[79][80]
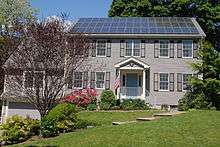 Photovoltaic panels on the roof of a house in Boston
 Photovoltaic panels on a town hall
 Photovoltaic panels on a school building
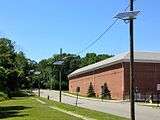 Pole-attached solar panels in New Jersey
Solar PV capacity and generation
In the United States, 14,626 MW of PV was installed in 2016, a 95% increase over 2015 (7,493 MW). During 2016, 22 states added at least 100 MW of capacity.[81] Just 4,751 MW of PV installations were completed in 2013.
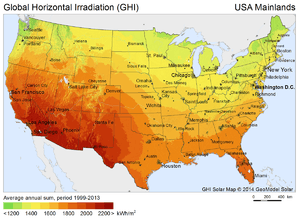
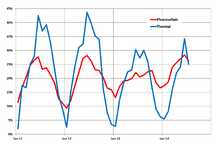
The amount of electricity a unit is capable of producing over an extended period of time is determined by multiplying the capacity by the capacity factor. The capacity factor for solar photovoltaic units is largely a function of climate and latitude. The National Renewable Energy Laboratory has calculated that the highest statewide average solar voltaic capacity factors are in Arizona, New Mexico, and Nevada (each 26.3 percent), and the lowest is Alaska (10.5 percent). The lowest statewide average capacity factor in the contiguous 48 states is in West Virginia (17.2 percent).[82]
| Total (MWp) | YOY Growth | Installed Capacity (MWp) | |
|---|---|---|---|
| 1992 | 43.5 | ||
| 1993 | 50.3 | 15.60% | 6.8 |
| 1994 | 57.8 | 14.90% | 7.5 |
| 1995 | 66.8 | 15.60% | 9 |
| 1996 | 76.5 | 14.50% | 9.7 |
| 1997 | 88.2 | 15.30% | 11.7 |
| 1998 | 100.1 | 13.50% | 11.9 |
| 1999 | 117.3 | 17.20% | 17.2 |
| 2000 | 138.8 | 18.30% | 21.5 |
| 2001 | 167.8 | 20.90% | 29 |
| 2002 | 212.2 | 26.50% | 44.4 |
| 2003 | 275.2 | 29.70% | 63 |
| 2004 | 376 | 36.60% | 100.8 |
| 2005 | 479 | 27.40% | 103 |
| 2006 | 624 | 30.30% | 145 |
| 2007 | 830.5 | 33.10% | 206.5 |
| 2008 | 1,169 | 40.70% | 338 |
| 2009 | 1,642 | 40.50% | 473.1 |
| 2010 | 2,534 | 55.90% | 918 |
| 2011 | 4,383 | 73.20% | 1,855 |
| 2012 | 7,221 | 75.60% | 3,313 |
| 2013 | 11,972 | 65.80% | 4,751 |
| 2014 | 18,173 | 51.80% | 6,201 |
| 2015 | 25,459 | 40.10% | 7,286 |
| 2016 | 40,221 | 58.00% | 14,762 |
| No | Jurisdiction | 2015 | 2014 | 2013 | 2012 | 2011 | 2010 | 2009 | 2008 | 2007 |
|---|---|---|---|---|---|---|---|---|---|---|
| - | United States | 25,459 | 18,173 | 12,090.2 | 7,373.8 | 4,010.7 | 2,165.7 | 1,261.6 | 791.7 | 474.8 |
| 1 | California | 13,243 | 9,977 | 5,183.4 | 2,559.3 | 1,563.6 | 1,021.7 | 768.0 | 528.3 | 328.8 |
| 2 | Arizona | 2,303 | 2,069 | 1,563.1 | 1,106.4 | 397.6 | 109.8 | 46.2 | 25.3 | 18.9 |
| 3 | North Carolina | 2,087 | 1,245 | 469.0 | 207.9 | 85.5 | 40.0 | 12.5 | 4.7 | 0.7 |
| 4 | New Jersey | 1,632 | 1,574 | 1,184.6 | 955.7 | 565.9 | 259.9 | 127.5 | 70.2 | 43.6 |
| 5 | Nevada | 1,240 | 823 | 424.0 | 349.7 | 124.1 | 104.7 | 36.4 | 34.2 | 18.8 |
| 6 | Massachusetts | 1,020 | 734 | 445.0 | 207.3 | 74.6 | 38.2 | 17.7 | 7.5 | 4.6 |
| 7 | New York | 638 | 394 | 240.5 | 179.4 | 123.8 | 55.5 | 33.9 | 21.9 | 15.4 |
| 8 | Hawaii | 564 | 447 | 358.2 | 199.5 | 85.2 | 44.7 | 26.2 | 13.5 | 4.5 |
| 9 | Colorado | 544 | 396 | 360.4 | 299.6 | 196.7 | 121.1 | 59.1 | 35.7 | 14.6 |
| 10 | Texas | 534 | 330 | 215.9 | 140.3 | 85.6 | 34.5 | 8.6 | 4.4 | 3.2 |
| 11 | Georgia | 370 | 161 | 109.9 | 21.4 | 6.9 | 1.8 | 0.2 | <0.1 | <0.1 |
| 12 | New Mexico | 365 | 325 | 256.6 | 203.4 | 165.5 | 43.3 | 2.4 | 1.0 | 0.5 |
| 13 | Maryland | 349 | 205 | 175.4 | 116.8 | 37.1 | 12.8 | 5.6 | 3.1 | 0.7 |
| 14 | Pennsylvania | 258 | 245 | 180.2 | 164.3 | 133.1 | 54.8 | 7.3 | 3.9 | 0.9 |
| 15 | Utah | 255 | 24 | 16.0 | 10.0 | 4.4 | 2.1 | 0.6 | 0.2 | 0.2 |
| 16 | Connecticut | 219 | 128 | 77.1 | 39.6 | 31.1 | 24.6 | 19.7 | 8.8 | 2.8 |
| 17 | Florida | 200 | 159 | 137.3 | 116.9 | 95.0 | 73.5 | 38.7 | 3.0 | 2.0 |
| 18 | Indiana | 136 | 112 | 49.4 | 4.4 | 3.5 | 0.5 | 0.3 | <0.1 | <0.1 |
| 19 | Missouri | 131 | 111 | 48.9 | 18.5 | 2.0 | 0.7 | 0.2 | <0.1 | <0.1 |
| 20 | Tennessee | 129 | 118 | 64.8 | 45.0 | 22.0 | 5.7 | 0.9 | 0.4 | 0.4 |
| 21 | Oregon | 114 | 84 | 62.8 | 56.4 | 35.8 | 23.9 | 14.0 | 7.7 | 2.8 |
| 22 | Ohio | 113 | 102 | 98.4 | 79.9 | 31.6 | 20.7 | 2.0 | 1.4 | 1.0 |
| 23 | Vermont | 107 | 64 | 41.5 | 28.0 | 11.7 | 3.9 | 1.7 | 1.1 | 0.7 |
| 24 | Louisiana | 92 | 60 | 46.6 | 18.2 | 13.4 | 2.6 | 0.2 | <0.1 | <0.1 |
| 25 | Delaware | 70 | 61 | 62.8 | 46.1 | 26.5 | 5.6 | 3.2 | 1.8 | 1.2 |
| 26 | Illinois | 65 | 54 | 43.4 | 42.9 | 16.2 | 15.5 | 4.5 | 2.8 | 2.2 |
| 27 | Washington | 62 | 39 | 27.4 | 19.5 | 12.3 | 8.0 | 5.2 | 3.7 | 1.9 |
| 28 | Minnesota | 33 | 20 | 15.1 | 11.3 | 4.8 | 3.6 | 1.9 | 1.0 | 0.5 |
| 29 | Iowa | 27 | 21 | 4.6 | 1.2 | 0.1 | <0.1 | <0.1 | <0.1 | <0.1 |
| 30 | Wisconsin | 25 | 20 | 22.5 | 21.1 | 12.9 | 8.7 | 5.3 | 3.1 | 1.4 |
| 31 | New Hampshire | 22 | 7.0 | 4.0 | 2.0 | 2.0 | 2.0 | 0.7 | 0.1 | 0.1 |
| 32 | Virginia | 21 | 11 | 12.6 | 10.5 | 4.5 | 2.8 | 0.8 | 0.2 | 0.2 |
| 33 | Arkansas | 20.1 | 3.8 | 1.8 | 1.5 | 1.1 | 1.0 | 0.2 | <0.1 | <0.1 |
| 34 | Maine | 19.4 | 12.7 | 5.3 | 2.8 | 1.1 | 0.3 | 0.3 | 0.3 | 0.2 |
| 35 | Michigan | 19 | 14 | 12 | 10 | 8.8 | 2.6 | 0.7 | 0.4 | 0.4 |
| 36 | Rhode Island | 17.1 | 12.6 | 7.6 | 1.9 | 1.2 | 0.6 | 0.6 | 0.6 | 0.6 |
| 37 | D.C. | 17 | 10 | 16.5 | 13.9 | 11.6 | 4.5 | 1.0 | 0.7 | 0.5 |
| 38 | South Carolina | 15 | 12 | 8.0 | 4.6 | 4.1 | 0.9 | 0.1 | <0.1 | <0.1 |
| 39 | Kentucky | 9.5 | 8.4 | 7.9 | 4.8 | 3.3 | 0.2 | <0.1 | <0.1 | <0.1 |
| 40 | Oklahoma | 5.2 | 1.5 | 0.7 | 0.3 | 0.2 | <0.1 | <0.1 | <0.1 | <0.1 |
| 41 | Kansas | 4.7 | 2.3 | 1.1 | 0.5 | 0.2 | <0.1 | <0.1 | <0.1 | <0.1 |
| 42 | Idaho | 4.6 | 2.6 | 1.8 | 1.0 | 0.4 | 0.4 | 0.2 | <0.1 | <0.1 |
| 43 | Montana | 4.5 | 4.0 | 3.0 | 2.2 | 0.7 | 0.7 | 0.7 | 0.7 | 0.5 |
| 44 | West Virginia | 3.4 | 2.6 | 2.2 | 1.7 | 0.6 | <0.1 | <0.1 | <0.1 | <0.1 |
| 45 | Alabama | 2.0 | 1.9 | 1.9 | 1.1 | 0.5 | 0.4 | 0.2 | <0.1 | <0.1 |
| 46 | Wyoming | 1.5 | 1.2 | 1.0 | 0.6 | 0.2 | 0.2 | 0.1 | <0.1 | <0.1 |
| 47 | Mississippi | 1.1 | 1.0 | 1.0 | 0.7 | 0.6 | 0.3 | 0.1 | <0.1 | <0.1 |
| 48 | Nebraska | 1.1 | 0.8 | 0.6 | 0.4 | 0.3 | 0.2 | <0.1 | <0.1 | <0.1 |
| 49 | Alaska | 0.72 | 0.39 | 0.2 | <0.1 | <0.1 | <0.1 | <0.1 | <0.1 | <0.1 |
| 50 | South Dakota | 0.24 | 0.22 | <0.1 | <0.1 | <0.1 | <0.1 | <0.1 | <0.1 | <0.1 |
| 51 | North Dakota | 0.22 | 0.22 | 0.2 | 0.1 | <0.1 | <0.1 | <0.1 | <0.1 | <0.1 |
The U.S. had approximately 440 MW of off-grid photovoltaics as of the end of 2010. Through the end of 2005, a majority of photovoltaics in the United States was off-grid.[43]:p.6[96]
| Year | utility scale | Est. distributed generation (GWh) |
Est. total generation (GWh) | ||||||
|---|---|---|---|---|---|---|---|---|---|
| Summer capacity (GW) |
Generation (GWh) |
Cap. factor | Capacity YOY growth |
Generation YOY growth |
Portion of renewable electricity |
Portion of total electricity | |||
| 2008 | 76 | 0.225 | 375.00% | 0.02% | 0.002% | ||||
| 2009 | 157 | 0.206 | 106.58% | 0.04% | 0.004% | ||||
| 2010 | 423 | 0.203 | 169.43% | 0.10% | 0.01% | ||||
| 2011 | 1.05 | 1,012 | 0.191 | 138.77% | 0.20% | 0.02% | |||
| 2012 | 2.69 | 3,451 | 0.203 | 156.19% | 241.01% | 0.70% | 0.09% | ||
| 2013 | 4.98 | 8,121 | 0.194 | 85.13% | 135.32% | 1.56% | 0.20% | ||
| 2014 | 8.3687 | 15,250 | 0.259 | 68.05% | 87.28% | 2.83% | 0.37% | 11,233 | 26,482 |
| 2015 | 11.6297 | 23,232 | 0.286 | 38.97% | 52.34% | 4.23% | 0.57% | 14,139 | 35,805 |
| 2016 | 32,670 | 18,812 | 51,483 | ||||||
| Year | Summer capacity (GW) |
Electricity generation (TWh) |
Capacity factor | Yearly growth of generating capacity |
Yearly growth of produced energy |
Portion of renewable electricity |
Portion of total electricity |
|---|---|---|---|---|---|---|---|
| 2017 | 24.91 | 49.56 | 0.227 | 23.0% | 51.0% | 7.2% | 1.20% |
| 2016 | 20.19 | 32.67 | 0.183 | 66.0% | 54.0% | 5.4% | 0.80% |
| 2015 | 11.91 | 23.233 | 0.208 | 36.5% | 36.5% | 4.0% | 0.53% |
| 2014 | 8.37 | 15.87 | 0.216 | 56.74% | 90.55% | 2.94% | 0.39% |
| 2013 | 5.34 | 8.33 | 0.178 | 98.51% | 141.45% | 1.60% | 0.20% |
| 2012 | 2.69 | 3.45 | 0.146 | 156.19% | 241.58% | 0.70% | 0.09% |
| 2011 | 1.05 | 1.01 | 0.110 | 138.77% | 0.20% | 0.02% | |
| 2010 | 0.423 | 0.203 | 169.43% | 0.10% | 0.01% | ||
| 2009 | 0.157 | 0.206 | 106.58% | 0.04% | 0.00% | ||
| 2008 | 0.076 | 0.225 | 375.00% | 0.02% | 0.00% | ||
| 2007 | 0.016 | 6.67% | 0.00% | 0.00% | |||
| 2006 | 0.015 | -6.25% | 0.00% | 0.00% | |||
| 2005 | 0.016 | 166.67% | 0.00% | 0.00% | |||
| 2004 | 0.006 | 0.00% | 0.00% | 0.00% |
Government support
A complete list of incentives is maintained at the Database of State Incentives for Renewable Energy (DSIRE) (see external link). Most solar power systems are grid connected and use net metering laws to allow use of electricity in the evening that was generated during the daytime. New Jersey leads the nation with the least restrictive net metering law,[98] while California leads in total number of homes which have solar panels installed. Many were installed because of the million solar roof initiative.[99]
In some states, such as Florida, solar power is subject to legal restrictions that discourage its use.[100]
Federal
The federal tax credit for solar was extended for eight years as part of the financial bail out bill, H.R. 1424, until the end of 2016. It was estimated this will create 440,000 jobs, 28 gigawatts of solar power, and lead to a $300 billion market for solar panels. This estimate did not take into account the removal of the $2,000 cap on residential tax credits at the end of 2008.[101]
A 30% tax credit is available for residential and commercial installations.[102][103] For 2009 through 2011 this was a 30% grant, not a tax credit, known as the 1603 grant program.[104]
The federal Residential Energy Efficient Property Credit (income tax credit on IRS Form 5695) for residential PV and solar thermal was extended in December 2015 to remain at 30% of system cost (parts and installation) for systems put into service by the end of 2019, then 26% until the end of 2020, and then 22% until the end of 2021. It applies to a taxpayer's principal and/or second residences, but not to a property that is rented out. There is no maximum cap on the credit, and the credit can be applied toward the Alternative Minimum Tax, and any excess credit (greater than that year's tax liability) can be rolled into the following year.[105][106]
The solar industry and utilities clashed extensively on renewal, but the solar industry prevailed.[107] The renewal is expected to add $38 billion of investment for 20 GigaWatts of solar.[108]
Section 1603 grants
President Obama’s stimulus bill in 2009 created a program known as Section 1603 grants. The program was designed to give federal grants to solar companies for 30 percent of investments into solar energy. Since 2009, the federal government has given solar companies $25 billion in grant money through this program. The Section 1603 grant program expired in 2011.[109]
The United States Treasury Department has been investigating solar companies for potential fraud since 2013. The department promised a report by June 2015, but a release of such a report has not yet occurred as of April 2016.[109]
Congressional investigators, led by U.S. Senators Jeff Flake and Lisa Murkowski, wrote a letter in early March 2016 to the Inspector General’s office of the Treasury Department. The letter asked the office to give Congress an update on the investigations and cited the department’s own statements saying that Section 1603 applicants might have claimed $1.3 billion in “unwarranted cash grants.”[109]
On June 9, 2016, Senator Orrin Hatch requested from Department of Treasury, the Internal Revenue Service (IRS) and the Treasury Inspector General for Tax Administration (TIGTA) details about how companies use Section 1603 grants and tax credits. In March 2016, Hatch asked the IRS and Treasury Department to demonstrate that the agencies use safeguards and coordinate with each other when reviewing applications for Section 1603 grants.[110]
Solar America Initiative
The United States Department of Energy (DOE) announced on September 29, 2008 that it will invest $17.6 million, subject to annual appropriations, in six company-led, early-stage photovoltaic (PV) projects under the Solar America Initiative's "PV Incubator" funding opportunity. The "PV Incubator" project is designed to fund prototype PV components and systems with the goal of moving them through the commercialization process by 2010. The 2008 award is the second funding opportunity released under the PV Incubator project. With the cost share from industry, which will be at least 20%, up to $35.4 million will be invested in these projects. The projects will run for 18 months, and will be subcontracted through DOE's National Renewable Energy Laboratory.
Most of the projects were to receive up to $3 million in funding, with the exception of Solasta and Spire Semiconductor, which would receive up to $2.6 million and $2.97 million, respectively. Massachusetts-based 1366 Technologies will develop a new cell architecture for low-cost, multi-crystalline silicon cells, which will enhance cell performance through improved light-trapping texturing and grooves for self-aligned metallization fingers. California's Innovalight will use ink-jet printing to transfer their "silicon ink" onto thin-crystalline silicon wafers to produce high-efficiency, low-cost solar cells and modules. Skyline Solar, also in California, will develop an integrated, lightweight, single-axis tracked system that reflects and concentrates sunlight over 10 times onto silicon cells. Solasta, in Massachusetts, is working on a novel cell design that increases currents and lowers the materials cost. Solexel, another California-based company, will commercialize a disruptive, 3D high-efficiency mono-crystalline silicon cell technology that dramatically reduces manufacturing cost per watt. Finally, Spire Semiconductor in New Hampshire will develop three-junction tandem solar cells that better optimize the optical properties of their device layers; the company is targeting cell efficiencies over 42% using a low-cost manufacturing method.
The PV Incubator project is part of the Solar America Initiative, which aims to make solar energy cost-competitive with conventional forms of electricity by 2015 (grid parity).[111][112]
The U.S. Department of Energy Solar Energy Technology Program (SETP) will achieve the goals of the SAI through partnerships and strategic alliances by focusing primarily on four areas:
- Market Transformation – activities that address marketplace barriers and offer the opportunity for market expansion
- Device and Process Proof of Concept – R&D activities addressing novel devices or processes with potentially significant performance or cost advantages
- Component Prototype and Pilot-Scale Production – R&D activities emphasizing development of prototype PV components or systems produced at pilot-scale with demonstrated cost, reliability, or performance advantages
- System Development and Manufacturing – collaborative R&D activities among industry and university partners to develop and improve solar energy technologies
The Solar America Showcases activity is part of the Solar America Initiative (SAI), and preference is given to large-scale, highly visible, highly replicable installations that involve cutting-edge solar technologies or novel applications of solar.[113]
SunShot Initiative
The SunShot Initiative was announced by the Department of Energy and aims to reduce the cost of solar power by 75% from 2010 to 2020. The name is based on "moon shot", Kennedy's target of reaching the moon within the decade.[114]
Goals:
- Residential system prices reduced from $6/W to $1.50/W
- Commercial system prices reduced from $5/W to $1.25/W
- Utility-scale system prices reduced from $4/W to $1.00/W (CSP, CPV and PV)
The Energy Department on December 7 announced a $29 million investment in four projects that will help advance affordable, reliable clean energy for U.S. families and businesses. The $29 million would be separated into two investments:
- $21 million investment over five years to design plug-and-play photovoltaic (PV) systems that can be purchased, installed, and operational in one day.
- $8 million investment in two projects to help utilities and grid operators better forecast when, where, and how much solar power will be produced at U.S. solar energy plants.
Fraunhofer USA’s Center for Sustainable Energy Systems in Cambridge, Massachusetts, will develop PV technologies that allow homeowners to easily select the right solar system for their house and install, wire and connect to the grid.
North Carolina State University will lead a project to create standard PV components and system designs that can adapt simply to any residential roof and can be installed and connected to the grid quickly and efficiently.
IBM Thomas J. Watson Research Center in Armonk, New York, will lead a new project based on the Watson computer system that uses big data processing and self-adjusting algorithms to integrate different prediction models and learning technologies.
These projects are working with the Energy Department and the National Oceanic and Atmospheric Association to improve the accuracy of solar forecasts and share the results of this work with industry and academia.[115]
State and local
.jpg)
- Governor Jerry Brown has signed legislation requiring California's utilities to get 50 percent of their electricity from renewable energy sources by the end of 2030.[9]
- The San Francisco Board of Supervisors passed solar incentives of up to $6,000 for homeowners and up to $10,000 for businesses.[116] Applications for the program began on July 1, 2008.[117] in April 2016, they passed a law requiring all new buildings below 10 stories to have rooftop solar panels, making it the first major U.S. city to do so[118]
- In 2008, Berkeley initiated a revolutionary pilot program where homeowners are able to add the cost of solar panels to their property tax assessment, and pay for them out of their electricity cost savings.[119] In 2009, more than a dozen states passed legislation allowing property tax financing. In all, 27 states offer loans for solar projects[120] (though after the conclusion of the pilot program, due to issues with Fannie Mae and Freddie Mac, Berkeley no longer offers this financing mechanism[121]).
- The California Solar Initiative has set a goal to create 3,000 megawatts of new, solar-produced electricity by 2016.
- New Hampshire has a $3,750 residential rebate program for up to 50% of system cost for systems less than 5 kWp ($6,000 from July 1, 2008 until 2010).[122]
- Louisiana has a 50 per cent tax credit up to $12,500 for the installation of a wind or solar system.[123][124]
- New Jersey law provides new solar power installations with exemptions from the 7% state sales tax, and from any increase in property assessment (local property tax increases), subject to certain registration requirements.[125][126]
Feed-in Tariff
Experience has demonstrated that a feed-in tariff is both the least expensive and the most effective means of developing solar power. Investors need certainty, which they receive from a feed-in tariff.[127] California enacted a feed-in tariff which began on February 14, 2008.[128][129] Washington state has a feed-in tariff of 15 ¢/kWh which increases to 54 ¢/kWh if components are manufactured in the state.[130] Hawaii,[131] Michigan,[132] and Vermont[133] also have feed in tariffs.[134]
In 2010, the Federal Energy Regulatory Commission (FERC) ruled that states were able to implement above-market feed-in tariffs for specific technologies.[135][136]
Solar Renewable Energy Certificates
In recent years, states that have passed Renewable Portfolio Standard (RPS) or Renewable Electricity Standard (RES) laws have relied on the use of Solar renewable energy certificates (SRECs) to meet state requirements. This is done by adding a specific solar carve-out to the state Renewable Portfolio Standard (RPS). The first SREC program was implemented in 2005 by the state of New Jersey and has since expanded to several other states, including Maryland, Delaware, Ohio, Massachusetts, North Carolina and Pennsylvania.[137]
An SREC program is an alternative to the feed-in tariff model popular in Europe. The key difference between the two models is the market-based mechanism that drives the value of the SRECs, and therefore the value of the subsidy for solar. In a feed-in tariff model, the government sets the value for the electricity produced by a solar facility. If the level is higher, more solar power is built and the program is more costly. If the feed-in tariff is set lower, less solar power is built and the program is ineffective. The problem with SRECs is a lack of certainty for investors. A feed-in tariff provides a known return on investment, while an SREC program provides a possible return on investment.
Power Purchase Agreement
In 2006 investors began offering free solar panel installation in return for a 25-year contract, or Power Purchase Agreement, to purchase electricity at a fixed price, normally set at or below current electric rates.[138][139] By 2009 over 90% of commercial photovoltaics installed in the United States were installed using a power purchase agreement.[140] Approximately 90% of the photovoltaics installed in the United States is in states that specifically address power purchase agreements.[141]
New construction mandates
In March 2013, Lancaster California became the first U.S. city to mandate the inclusion of solar panels on new homes, requiring that "every new housing development must average 1 kilowatt per house."[142]
PACE
An innovative financing arrangement pioneered in Berkeley, California, and Palm Springs, lends money to a homeowner for a solar system, to be repaid via an additional tax assessment on the property for 20 years. This allows installation of the solar system at "relatively little up-front cost to the property owner."[143] Now known as PACE, for Property Assessed Clean Energy, it is available in 28 states.[144] Freddie Mac and Fannie Mae have objected to the repayment of solar loans being senior to mortgage loans, and some states have relegated PACE loans to junior loans. HR 2599 was introduced to prevent interference with the PACE program by other lenders.[145] The principal feature of the program is that the balance of the loan is transferred to the new owners in the event the property is sold, and the loan is paid for entirely through electric bill savings. Unlike a mortgage loan, no funds are transferred when the property is sold - only the repayment obligation is transferred.
PACE programs are currently operating in eight states, California, Colorado, Florida, Maine, Michigan, Missouri, New York, and Wisconsin, and are on hold in many others, pending resolution of the Freddie Mac, Fannie Mae objection.[146]
Controversy and congressional investigation
On September 14, 2016, the Senate Finance Committee and the House Ways and Means Committee expanded on a formal investigation into the billions of dollars in tax incentives that solar-energy companies received. The investigation also focused on whether the Obama administration improperly gave out solar tax credits. Committee investigators sent official letters to seven domestic and foreign solar industry companies, which include the following: three firms in the residential solar industry, (SolarCity, Sunrun, and Sungevity) and four solar utility companies (SunEdison, Abengoa, NextEra Energy and NRG Energy).[147]
The investigational probe was led by Senator Orrin Hatch (R-Utah), the chairman of the Senate Finance Committee, and U.S. Representative Kevin Brady (R-Texas), the chairman of the Ways and Means Committee. Committee investigators reviewed the use of tax incentives for solar power companies and their third-party financing. According to Utility Dive, "Solar advocates last year pressed for the extension of the tax credit, maintaining it was necessary to level the playing field against more established technologies, and to help push forward with greenhouse gas reduction goals."[148]
In early 2016, Sen. Hatch began examining the nearly $25 billion in cash grants that "green energy" firms have accumulated during the course of the Obama Administration. Hatch concluded that the Internal Revenue Service and the Treasury Department do not have adequate controls over the program. According to the Wall Street Journal, "The green energy tax program was launched in 2009 as part of President Barack Obama’s plan to stimulate the U.S. economy and promote investments in renewable energy in the aftermath of the financial crisis."[147]
Generation (PV and CSP)
| Year | NREL Total |
EIA Util Total |
EIA Util % of total |
Jan | Feb | Mar | Apr | May | Jun | Jul | Aug | Sept | Oct | Nov | Dec |
|---|---|---|---|---|---|---|---|---|---|---|---|---|---|---|---|
| 1998 | 502 | ||||||||||||||
| 1999 | 495 | ||||||||||||||
| 2000 | 804 | 493 | |||||||||||||
| 2001 | 822 | 543 | |||||||||||||
| 2002 | 857 | 555 | 11 | 24 | 44 | 46 | 58 | 96 | 86 | 75 | 53 | 31 | 28 | 4 | |
| 2003 | 929 | 534 | 13 | 18 | 50 | 60 | 68 | 91 | 63 | 62 | 56 | 36 | 14 | 4 | |
| 2004 | 1,020 | 575 | 0.01% | 13 | 11 | 53 | 57 | 82 | 88 | 82 | 73 | 61 | 34 | 15 | 8 |
| 2005 | 1,145 | 551 | 0.01% | 8 | 13 | 37 | 57 | 81 | 87 | 71 | 75 | 60 | 37 | 12 | 2 |
| 2006 | 1,312 | 508 | 0.01% | 13 | 20 | 33 | 52 | 71 | 70 | 62 | 83 | 54 | 32 | 16 | 3 |
| 2007 | 1,718 | 612 | 0.01% | 13 | 19 | 48 | 54 | 84 | 84 | 86 | 75 | 68 | 48 | 23 | 3 |
| 2008 | 2,208 | 864 | 0.02% | 16 | 36 | 75 | 94 | 99 | 128 | 111 | 105 | 93 | 60 | 29 | 19 |
| 2009 | 2,922 | 892 | 0.02% | 7 | 30 | 78 | 99 | 110 | 103 | 121 | 116 | 95 | 68 | 40 | 21 |
| 2010 | 4,505 | 1,212 | 0.03% | 10 | 33 | 76 | 112 | 153 | 176 | 161 | 156 | 138 | 75 | 77 | 44 |
| 2011 | 7,454 | 1,818 | 0.04% | 40 | 85 | 122 | 164 | 191 | 223 | 191 | 229 | 186 | 159 | 107 | 121 |
| 2012 | 12,692 | 4,327 | 0.11% | 95 | 135 | 231 | 319 | 462 | 527 | 509 | 462 | 458 | 431 | 347 | 349 |
| 2013 | 21,074 | 9,253 | 0.23% | 318 | 479 | 668 | 734 | 826 | 930 | 861 | 1,001 | 979 | 967 | 750 | 737 |
| 2014 | 32,553 | 18,321 | 0.45% | 775 | 858 | 1,355 | 1,607 | 1,880 | 2,061 | 1,874 | 1,937 | 1,925 | 1,701 | 1,387 | 985 |
| 2015 | 44,296 | 26,473 | 0.65% | 1,173 | 1,634 | 2,221 | 2,567 | 2,665 | 2,765 | 2,813 | 2,880 | 2,350 | 2,021 | 1,889 | 1,623 |
| 2016 | 52,833[149] | 36,754 | 0.90% | 1,546 | 2,423 | 2,721 | 2,981 | 3,644 | 3,591 | 4,064 | 3,936 | 3,613 | 3,132 | 2,642 | 2,299 |
| 2017 | 77,097[150] | 52,958 | 1.32% | 2,220 | 2,562 | 4,475 | 4,816 | 5,815 | 6,272 | 5,544 | 5,427 | 5,145 | 4,804 | 3,072 | 3,059 |
| 2018 | 40,285 | 1.66% | 3,262 | 4,037 | 5,099 | 6,111 | 7,091 | 7,815 | 6,869 | ||||||
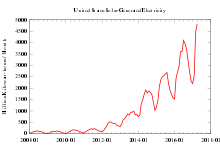
| Last entry, % of Total | 0.87% | 1.31% | 1.59% | 2.02% | 2.09% | 2.11% | 1.67% | 1.43% | 1.54% | 1.50% | 1.00% | 0.88% | |||
NREL includes distributed generation, EIA, including the monthly data above, includes only utility generation. "EIA % of total" is the percent of all electricity produced that is generated by utility solar.
See also
References
- ↑ "The 5 Big Questions About Solar After Trump's Tariffs - GV Wire". GV Wire. 2018-01-25. Retrieved 2018-02-06.
- ↑ US Energy Information Administration, Table 1.1.A. Net Generation by Other Renewable Sources: Total (All Sectors), 2003–July 2013, Table 1.1. Net Generation by Energy Source: Total (All Sectors), 2003–Dec 2013, accessed 1. dec 2015.
- ↑ US Solar Market Grows 95% in 2016, Smashes Records, Greentech Media, Mike Munsell, February 15, 2017
- ↑ "Clean-Energy Jobs Surpass Oil Drilling for First Time in U.S." Bloomberg.com. May 25, 2016. Retrieved October 12, 2016.
- ↑ "U.S. Solar Market Grows 95% in 2016, Smashes Records | SEIA". SEIA. Retrieved 2017-10-27.
- ↑ "Segs Iii, Iv, V, Vi, Vii, Viii & Ix". Fplenergy.com. Archived from the original on 2014-08-05. Retrieved 2012-01-31.
- ↑ "Brightsource Ivanpah".
- 1 2 Mearian, Lucas. U.S. flips switch on massive solar power array that also stores electricity: The array is first large U.S. solar plant with a thermal energy storage system, October 10, 2013. Retrieved October 18, 2013.
- 1 2 David R. Baker (October 7, 2015). "Brown signs climate law mandating 50% renewable power by 2030". San Francisco Chronicle.
- ↑ "Table 1. Accessible Resources, regardless of cost" (PDF). Retrieved 2012-01-31.
- ↑ "Annual Energy Outlook 2009 with Projections to 2030". Eia.doe.gov. Archived from the original on 2011-05-09. Retrieved 2012-01-31.
- ↑ "National Renewable Energy Laboratory: Solar Has The Most Potential Of Any Renewable Energy Source".
- ↑ "Electricity - U.S. Energy Information Administration (EIA)". www.eia.gov.
- ↑ "Renewable Energy Technical Potential - Geospatial Data Science - NREL". www.nrel.gov.
- ↑ "Solar Energy Grew at a Record Pace in 2008". Apps1.eere.energy.gov. Retrieved 2012-01-31.
- 1 2 3 Study: Solar Power Could Provide 10% of U.S. Electricity by 2025 June 25, 2008 retrieved 25 June 2009
- ↑ "Arizona Solar Power Doubled Solar Capacity in 2010". Solar-energy-installers.com. 2011-03-10. Retrieved 2012-01-31.
- ↑ Steve Leone (1 November 2011). "Survey Says ... 9 in 10 Americans Want More Solar Energy". RenewableEnergyWorld.
- ↑ "Direct Federal Financial Interventions and Subsidies in Energy in Fiscal Year 2013". Analysis and Projections. Energy Information Administration. 23 March 2015. Retrieved 10 November 2015.
- ↑ Cardwell, Diane (13 March 2013). "Solar Group Reports Surge in U.S. Installations" – via www.nytimes.com.
- ↑ "Solar power's stunning growth: US generation up 100 percent this year". CNBC. December 2, 2014. Retrieved December 5, 2014.
- ↑ "Solar Industry Growing at a Record Pace". SEIA. Retrieved June 11, 2017.
- ↑ Laura Wisland (September 4, 2014). "How Many Homes Have Rooftop Solar? The Number is Growing…". Union of Concerned Scientists. Retrieved 2014-12-10.
- ↑ Warrick, Joby (7 March 2015). "Utilities wage campaign against rooftop solar" – via www.washingtonpost.com.
- ↑ "Environmental History Timeline".
- ↑ The Power of Light: The Epic Story of Man's Quest to Harness the Sun, Frank Kryza, ISBN 9780071400213 p. 21
- ↑ "Sun Power Operates Pumping Plant" Popular Mechanics, December 1911, pp. 843–44.
- ↑ Kozlowski, Lori. "Solar Power: Karl Wolfgang Boer and a Lifetime of Green Discoveries". Los Angeles Times. Retrieved 1 October 2010.
- ↑ "World's Largest Solar Thermal Plant Syncs to the Grid". IEEE Spectrum: Technology, Engineering, and Science News.
- 1 2 3 "Solana, the largest parabolic trough plant in the world". Abengoa. Retrieved 2013-11-26.
- ↑ "solana - Diccionario Inglés-Español WordReference.com". www.wordreference.com.
- ↑ "The World's Largest Power Plants". industcards. 2009-02-21. Retrieved 2009-05-26.
- ↑ Mouawad, Jad (March 4, 2010). "The Newest Hybrid Model". The New York Times. Retrieved 2010-03-09.
- ↑ "DOE Finalizes $737 Million Loan Guarantee to Tonopah Solar Energy for Nevada Project" (Press release). Loan Programs Office (LPO), Dept. of Energy (DOE). September 28, 2011. Archived from the original on 15 October 2011. Retrieved 29 September 2011.
- ↑ {{cite web url=http://www.nrel.gov/csp/solarpaces/project_detail.cfm/projectID=60 |title=Crescent Dunes Solar Energy Project |author=National Renewable Energy Laboratory |date=November 10, 2015 |work}}
- ↑ Will the BrightSource-Abengoa Tower Be the Last CSP Project in the US?, GreenTech Media, Eric Wesoff, September 22, 2014
- ↑ Company To Withdraw Proposed Solar Tower Project in Inyo County, KCET, Chris Clarke, May 29, 2015
- ↑ California rejects new plan for Palen solar farm, Sammy Roth, The Desert Sun, February 10, 2016
- ↑ SEIA (Dec 2013). "U.S. Solar Market Insight Q4 2013". SEIA. Retrieved 2014-03-06.
- ↑ EIA (1 March 2016). "Solar, natural gas, wind make up most 2016 generation additions". EIA. Retrieved 2016-03-02.
- ↑ National Renewable Energy Laboratory (October 2010). "2009 U.S. State Clean Energy Data Book" (PDF). United States Department of Energy. Retrieved 2010-12-09.
- ↑ Office of Energy Efficiency and Renewable Energy (September 2011). "2010 Renewable Energy Data Book" (PDF). United States Department of Energy. Retrieved 2012-02-11.
- 1 2 Office of Energy Efficiency and Renewable Energy (November 2011). "2010 Solar Technologies Market Report" (PDF). United States Department of Energy. p. 10. Retrieved 2012-09-09.
- ↑ 2011 Renewable Energy Data Book p.64
- ↑ Office of Energy Efficiency and Renewable Energy (November 2013). "2012 Renewable Energy Data Book" (PDF). United States Department of Energy. Retrieved 2013-12-04.
- 1 2 "Solar Market Insight Report 2013 Year in Review - SEIA". SEIA.
- ↑ "Solar Market Insight Report 2014 Q4 - SEIA". SEIA.
- ↑ U.S. Solar Market Sets New Record, Installing 7.3 GW of Solar PV in 2015 Retrieved 2 March 2016
- 1 2 "Electric Power Monthly". US Energy Information Administration.
- ↑ "Panasonic to lay off 50 at Salem solar panel factory". OregonLive.com. Retrieved 2017-02-05.
- ↑ Staff, WTOL. "First Solar's Perrysburg facility announces layoffs". Retrieved 2017-02-05.
- ↑ "Hillsboro/Oregon". SolarWorld. Retrieved 2017-02-05.
- ↑ Korosec, Kirsten. "GE postpones thin-film solar factory plans - ZDNet".
- ↑ "Implications of the US-China Solar Tariff on Project Development - Sol Systems". Sol Systems.
- ↑ http://thehill.com/policy/energy-environment/370895-solar-company-puts-hold-on-20m-us-investment-following-new-tariff
- ↑ "SolarCity investing $5B in Buffalo, creating 3,000 jobs". 23 September 2014. Archived from the original on 4 October 2014.
- ↑ Steve Leone (7 December 2011). "Billionaire Buffett Bets on Solar Energy". Renewable Energy World.
- 1 2 America's Largest PV Power Plant Is Now Live (December 6, 2010), Renewable Energy World.
- ↑ Copper Mountain Solar 2
- ↑ Copper Mountain Solar 3 Retrieved 2 March 2016
- ↑ "DOE Closes on Four Major Solar Projects". Renewable Energy World. 30 September 2011.
- ↑ "Excellence in Renewable Energy Awards Winners: Project of the Year and Readers' Choice". Renewable Energy World. 17 February 2012.
- ↑ "Agua Caliente Reaches 200-Megawatt Milestone - SEIA". SEIA.
- ↑ "Exelon purchases 230 MW Antelope Valley Solar Ranch One from First Solar". Solar Server. 4 October 2011. Archived from the original on 18 January 2012.
- ↑ "AV Solar Ranch One Solar Power Plant Achieves 100 MW Milestone".
- ↑ 206MW Mt. Signal Solar Farm Completed, Energy Matters, May 22, 2014
- ↑ 32 GW of Utility-Scale Solar to Come Online Ahead of US 2017 ITC Deadline, IHS Says, June 8, 2015
- ↑ "Major Solar Projects List". Solar Energy Industries Association. 2014-03-06. Retrieved 2014-04-08.
- ↑ "Obama administration approves giant renewables projects". BusinessGreen. 22 Dec 2011.
- ↑ "SolarCity and Bank of America Merrill Lynch Move Forward With Project SolarStrong, Expected to Build More Than $1 Billion in Solar Projects". Marketwatch. 30 November 2011.
- 1 2 Bureau of Land Management (November 22, 2011). "2012 Renewable Energy Priority Projects". Archived from the original on January 28, 2012.
- ↑ US Bureau of Land Management, Solar Energy Program, 29 Nov. 2014.
- ↑ "Solar Energy Zones". solareis.anl.gov/sez. Solar Energy Development PEIS Information Center. Retrieved August 24, 2016.
- ↑ "Solar PEIS Maps". solareis.anl.gov.
- ↑ Solar Market Insight Report 2013 Year in Review (Report). Solar Energy Industries Association. 2014. Retrieved 17 July 2014.
- ↑ "New largest residential solar-electric project features SolarWorld turn-key Sunkits® system". SolarWorld Industries America (Press Release). 29 July 2011. Retrieved 17 July 2014.
- ↑ Shahan, Zachary (7 April 2012). "Largest Rooftop Solar Power Plant in North America Formally Completed". Clean Technica. Retrieved 17 July 2014.
- ↑ "San Diego Unified School District, AMSOLAR Corporation announce groundbreaking on solar power system June 8" (PDF). AMSOLAR (Press Release). 3 June 2011. Retrieved 17 July 2014.
- ↑ "Solar 4 All™ Fact Sheet" (PDF). PSE&G. Retrieved 17 July 2014.
- ↑ "The State of Solar Power in the U.S.: Current Trends" (PDF). Haynes Boone. 7 October 2010. Retrieved 17 July 2014.
- ↑ "U.S. Solar Market Grows 95% in 2016, Smashes Records | SEIA". SEIA. Retrieved 2017-10-27.
- ↑ Anthony Lopez, Billy Roberts, Donna Heimiller, Nate Blair, and Gian Porro, U.S. Renewable Energy Technical Potentials: A GIS-Based Analysis Archived 2012-09-15 at the Wayback Machine., National Renewable Energy Laboratory, Technical Report NREL/TP-6A20-51946, July 2012
- ↑ IEA PVPS Task 1 (2010), Trend Report 2009 (PDF), retrieved 28 March 2011
- ↑ EPIA Market Report (PDF), retrieved 23 February 2012
- ↑ "U.S. Solar Market Insight 2012 Year in Review - SEIA". SEIA.
- ↑ U.S. Solar Market Sets New Record, Installing 7.3 GW of Solar PV in 2015 Retrieved 2 March 2016
- ↑ Solar Market Insight Report 2016 Year In Review Retrieved 23 March 2017
- ↑ Sherwood, Larry (July 2014). "U.S. Solar Market Trends 2013" (PDF). Interstate Renewable Energy Council (IREC). Retrieved 2014-07-16.
- ↑ Sherwood, Larry (July 2013). "U.S. Solar Market Trends 2012" (PDF). Interstate Renewable Energy Council (IREC). Retrieved 2013-07-31.
- ↑ Sherwood, Larry (August 2012). "U.S. Solar Market Trends 2011" (PDF). Interstate Renewable Energy Council (IREC). Archived from the original (PDF) on 2012-09-06. Retrieved 2012-08-22.
- ↑ Sherwood, Larry (June 2011). "U.S. Solar Market Trends 2010" (PDF). Interstate Renewable Energy Council (IREC). Retrieved 2011-06-29.
- ↑ Sherwood, Larry (July 2010). "U.S. Solar Market Trends 2009" (PDF). Interstate Renewable Energy Council (IREC). Archived from the original (PDF) on 2010-09-25. Retrieved 2010-07-28.
- ↑ Sherwood, Larry (July 2009). "U.S. Solar Market Trends 2008" (PDF). Interstate Renewable Energy Council (IREC). Archived from the original (PDF) on 2009-11-23. Retrieved 2010-07-24.
- ↑ Sherwood, Larry (August 2008). "U.S. Solar Market Trends 2007" (PDF). Interstate Renewable Energy Council (IREC). Retrieved 2010-07-24.
- ↑ "Solar State by State".
- ↑ "2008 Solar Technologies Market Report" (PDF). NREL. January 2010. Retrieved 2012-09-09.
- ↑ Electric Power Monthly Retrieved 2 March 2016
- ↑ "Database of State Incentives for Renewables and Efficiency". Dsireusa.org. Retrieved 2012-01-31.
- ↑ "NC Clean Energy Technology Center - Advancing Clean Energy for a Sustainable Economy". www.ncsc.ncsu.edu.
- ↑ Halper, Evan (9 August 2014). "Rules prevent solar panels in many states with abundant sunlight" – via LA Times.
- ↑ Solar Investment Credit FINALLY Passed! retrieved 13 October 2008.
- ↑ Federal Solar Tax Credits Retrieved 15 August 2008.
- ↑ Residential Solar and Fuel Cell Tax Credit Retrieved 15 August 2008.
- ↑ "Why the 1603 Treasury Grant Program Matters to Solar and RE".
- ↑ "Residential Renewable Energy Tax Credit". Energy.gov. US Department of Energy. Retrieved April 29, 2016.
- ↑ "Federal Income Tax Credits for Energy Efficiency". EnergyStar.gov. US EPA. Retrieved December 21, 2016.
- ↑ "Solar Firms, Utilities Clash As 30% Tax Credit Fades". 8 October 2015.
- ↑ "Forget Oil Exports—What Just Happened to Solar is a Really Big Deal". 17 December 2015 – via www.bloomberg.com.
- 1 2 3 Bastach, Michael (2016-04-12). "Treasury Dept. Sitting On Investigation Into Solar Energy Fraud That's 'Two-And-A-Half Times Solyndra'". The Daily Caller. Retrieved 2016-04-26.
- ↑ "Hatch Continues Inquiry of Green Energy Programs". U.S. Senate Finance Committee. 2016-06-09. Retrieved 2016-06-20.
- ↑ "DOE to Invest $17.6 Million in Six Early-Stage Photovoltaic Projects". Apps1.eere.energy.gov. Retrieved 2012-01-31.
- ↑ "EERE: Solar Energy Technologies Program Home Page". .eere.energy.gov. Archived from the original on 2011-12-19. Retrieved 2012-01-31.
- ↑ DOE Announces Three Solar America Showcase Awards January 16, 2009 retrieved 28 March 2009
- ↑ "SunShot Initiative".
- ↑ "Energy Department Invests $29 Million in Solar Energy Grid Solutions".
- ↑ "San Francisco Offers Solar Subsidies". Greentechmedia.com. 2008-06-10. Retrieved 2012-01-31.
- ↑ "Final changes and logistics of the SF Solar Incentive Program Explained". Sfsolarsubsidy.com. Retrieved 2012-01-31.
- ↑ "San Francisco Requires New Buildings To Install Solar Panels".
- ↑ Berkeley FIRST Archived 2013-06-02 at the Wayback Machine. retrieved 25 June 2009
- ↑ Loan Programs retrieved 19 December 2009
- ↑ "Berkeley FIRST: Financing Initiative for Renewable and Solar Technology". City of Berkeley. Archived from the original on 2 June 2013. Retrieved 26 March 2013.
- ↑ Residential Small Renewable Electrical Generation Systems Rebate, New Hampshire Public Utilities Commission.
- ↑ "Tax Credit for Solar and Wind Energy Systems on Residential Property". Archived from the original on 2011-09-29.
- ↑ "Tax Credit for Solar and Wind Energy Systems on Residential Property". Archived from the original on 2012-04-17.
- ↑ "Solar Energy Sales Tax Exemption". DSIRE. NC Clean Energy Technology Center. Retrieved April 29, 2016.
- ↑ "Property Tax Exemption for Renewable Energy Systems". DSIRE. NC Clean Energy Technology Center. Retrieved April 29, 2016.
- ↑ "404". www.solarserver.com.
- ↑ "Are Feed-in Tariffs a Possibility in California?". Renewableenergyaccess.com. Retrieved 2012-01-31.
- ↑ "California Approves Feed-In Tariffs, Rewards Energy Efficiency". Eere.energy.gov. 2012-01-25. Retrieved 2012-01-31.
- ↑ "Washington State Passes Progressive Renewable Energy Legislation". Renewableenergyaccess.com. Archived from the original on 2007-02-13. Retrieved 2012-01-31.
- ↑ "Hawaii FIT".
- ↑ "Consumers Energy FIT".
- ↑ "Vermont SPEED".
- ↑ "Table of Financial Incentives". Archived from the original on 2013-01-19.
- ↑ "FERC Decision Clears the Way for Multi-Tiered State FITs".
- ↑ How to Design Feed-in Tariffs in the U.S. without Fear of Federal Preemption
- ↑ Bird, Lori; Heeter, Jenny; Kreycik, Claire (November 2011). "Solar Renewable Energy Certificate (SREC) Markets: Status and Trends" (PDF). National Renewable Energy Laboratory. Retrieved 2011-12-23.
- ↑ "MMA Renewable Ventures Solar Energy Program". Mmarenewableventures.com. Retrieved 2012-01-31.
- ↑ "U.S. Retailers Save with Solar PV & Energy Efficiency". Renewableenergyaccess.com. Retrieved 2012-01-31.
- ↑ Guice, Jon; King, John D.H. "Solar Power Services: How PPAs are Changing the PV Value Chain". greentechmedia.com. Green Tech Media. executive report
- ↑ "Power Purchase Agreement".
- ↑ "Lancaster, CA, Becomes First US City to Require Solar". Greentech Media. March 27, 2013.
- ↑ Berkeley FIRST Archived 2013-06-02 at the Wayback Machine.. Retrieved October 14, 2010.
- ↑ "Property Accessed Clean Energy" (PDF).
- ↑ "Bill Summary & Status".
- ↑ "PACE Financing".
- 1 2 Mullins, Brody; Dugan, Ianthe Jeanne; Rubin, Richard (2016-09-15). "Lawmakers Probe Tax Incentives Received by Solar-Energy Firms". Wall Street Journal. ISSN 0099-9660. Retrieved 2016-11-23.
- ↑ Walton, Robert (2016-09-16). "Congressional lawmakers launch query into solar tax credits". Utility Dive. Retrieved 2016-11-23.
- ↑ "EIA - Electricity Data". www.eia.gov.
- ↑ "EIA - Electricity Data". www.eia.gov.
- ↑ "2014 Renewable Energy Data Book" (PDF). November 2015. p. 29.
- ↑ EIA (July 2015). "Electric Power Monthly". United States Department of Energy. Retrieved 2015-07-27.
Further reading
- GA Mansoori, N Enayati, LB Agyarko (2016), Energy: Sources, Utilization, Legislation, Sustainability, Illinois as Model State, World Sci. Pub. Co., ISBN 978-981-4704-00-7
- Clean Tech Nation: How the U.S. Can Lead in the New Global Economy (2012) by Ron Pernick and Clint Wilder
- Deploying Renewables 2011 (2011) by the International Energy Agency
- Reinventing Fire: Bold Business Solutions for the New Energy Era (2011) by Amory Lovins
- Renewable Energy Sources and Climate Change Mitigation (2011) by the IPCC
- Solar Energy Perspectives (2011) by the International Energy Agency
External links
| Wikimedia Commons has media related to Solar power in the United States. |
- "Solar Power by Region (US)".
- Solar panels on the White House.
- Study: Solar Power Could Provide 10% of U.S. Electricity by 2025
- Sensitivity of Utility-Scale Solar Deployment Projections in the Sunshot Vision Study to Market and Performance Assumptions National Renewable Energy Laboratory
- The Database of State Incentives for Renewable Energy (DSIRE)
- Live monitoring of over 1400 solar installations
- Bureau of Land Management 2012 Renewable Energy Priority Projects
- Maps of approved solar energy zones in USA, additional mapping
- United States cloud coverage
- IRS Form 5695 – Residential Energy Credits and instructions
- Solar maps: NREL annual and monthly (CSP and PV), U.S. installations
| Africa | |||||
|---|---|---|---|---|---|
| Asia | |||||
| Europe |
| ||||
| North America | |||||
| Oceania | |||||
| South America | |||||
| |||||
Solar power in the Americas | ||
|---|---|---|
| ||
| Sovereign states |
| .svg.png) |
| ||