Solar power in Texas
Solar power in Texas, along with wind power, have the potential to allow Texas to remain an energy-exporting state. Texas has the largest solar and wind potential in the country.[2][3]
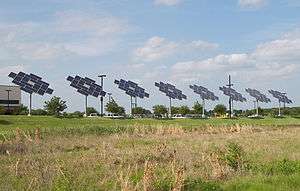
Solar farms
The largest which will produce 110 MWac / 133.10 MWdc, named Alamo 6, is under construction still in McCamey, Pecos County, Texas. Alamo 6 was sold for $385 million to Warren Buffett in January 2017. The largest solar farm in production in Texas is the 157 MW(AC), Roserock Solar which came online in September 2016, and next is 106 MW(AC) Alamo 7 which came online in September 2016 and next is the 95 MW(AC) Alamo 5 near San Antonio which came online in April 2016. Others include the 40 MW Alamo 4, which came online in September 2014; the 41 MW Alamo 1 solar farm, which came online in December 2013;[4] the 35 MW Webberville Solar Farm, near Austin, which began operation in December, 2011[5] and the 16.6 MW[6] Blue Wing Solar Project, at the intersection of I37 and US 181, southeast of San Antonio, which began operation in November, 2010.[7] Top solar contractors in Texas include Meridian Solar, Longhorn Solar, Axium Solar and Native.[8]
| Solar farm | Installed capacity (MWAC) | Year | City | County |
|---|---|---|---|---|
| Alamo 1 | 40.7 | 2013 | San Antonio | Bexar |
| Alamo 2[9] | 4.4 | 2014 | Converse | Bexar |
| Alamo 3[10] | 5.5 | 2015 | Converse | Bexar |
| Alamo 4[11] | 39.6 | 2014 | Brackettville | Kinney |
| Alamo 5[12] | 95 | 2016 | Uvalde | Uvalde |
| Alamo 6[13] | 105 | 2017 | Iraan | Pecos |
| Alamo 7 | 106 | 2016 | Haskell | Haskell |
| Barilla Solar Phase 1[14] | 18 | 2014 | Pecos | |
| Barilla Solar Phase 2[15] | 12 | 2015 | Pecos | |
| Blue Wing Solar Project[16] | 14.4 | 2010 | San Antonio | Bexar |
| Bryan Solar[17] | 10 | 2013 | Presidio | |
| Sinkin 1[18] | 9.9 | 2012 | San Antonio | Bexar |
| Buckthorn Solar | 154 | 2018 | Pecos | |
| East Pecos Solar[13] | 118.5 | 2017 | ||
| Lamesa Solar Project[13] | 100 | 2017 | ||
| PSEG El Paso Solar Energy Center | 10 | 2014 | El Paso | |
| Roserock Solar | 157.5 | 2016 | Pecos | |
| Sinkin 2 | 9.9 | 2012 | San Antonio | Bexar |
| SolaireHolman Solar Project[13] | 50 | 2017 | ||
| Somerset Solar Farm[19] | 10.6 | 2012 | Bexar | |
| Upton County Solar 2 | 180 | 2018 | Upton | |
| Webberville Solar Farm[20] | 30 | 2011 | Webberville | Travis |
Statistics
Installed capacity
| Texas Grid-Connected PV Capacity (MW)[21][22][23][24][25][26] | |||
|---|---|---|---|
| Year | Capacity | Change | % Change |
| 2007 | 3.2 | ||
| 2008 | 4.4 | 1.2 | 38% |
| 2009 | 8.6 | 4.2 | 95% |
| 2010 | 34.5 | 25.9 | 301% |
| 2011 | 85.6 | 51.1 | 148% |
| 2012 | 140.3 | 54.7 | 64% |
| 2013 | 215.9 | 75.6 | 54% |
| 2014 | 387 | 129 | 60% |
| 2015 | 534 | 207 | 53% |
Generation-utility scale
Using data available from the U.S. Energy Information Agency's Electric Power Annual 2016[27] and "Electric Power Monthly Data Browser",[28][29][30][31] the following table summarizes Texas’s solar energy posture.
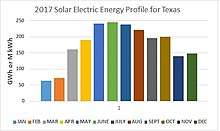
Capacity factor for each year was computed from the end-of-year summer capacity. 2017 data is from Electric Power Monthly and is subject to change.
| Year | Facilities | Summer capacity (MW) | Electric energy (GWh or M kWh) | Capacity factor | Yearly growth of generating capacity | Yearly growth of produced energy | % of TX renewable electric energy | % of TX generated electric energy | % of U.S. Solar electric energy |
|---|---|---|---|---|---|---|---|---|---|
| 2017 | 39 | 1221.7 | 2119 | 0.198 | 111% | 190% | 2.9% | 0.47% | 4.0% |
| 2016 | 578.9 | 731 | 0.144 | 82% | 1.2% | 32.9% | 0.16% | 2.0% | |
| 2015 | 317.9 | 401 | 0.144 | 71% | 42% | 0.8% | 0.09% | 1.6% | |
| 2014 | 185.7 | 282 | 0.173 | 73% | 0.70% | 0.06% | 1.5% | ||
Generation-small scale
Beginning with the 2014 data year, the Energy Information Administration (EIA) has estimated the distributed solar-photovoltaic generation and distributed solar-photovoltaic capacity.[32] These non-utility-scale appraisals evaluate that Texas generated the following amounts of additional solar energy:
| Year | Summer capacity (MW) | Electric energy (GWh or M kWh) |
|---|---|---|
| 2017 | 460.5 | 695 |
| 2016 | 277.1 | 391 |
| 2015 | 147.2 | 223 |
| 2014 | 96 | 141 |
Potential generation
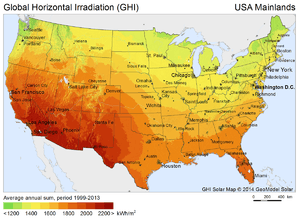
Covering half of the roof with 10% efficient photovoltaics is sufficient to generate all of the electricity used by an average family in Texas. Solar farms are more cost effective in West Texas, where insolation levels are greater.[34] The US uses about 100 quads of energy each year.[35] This number is expected to be reduced by 50% by 2050, due to efficiency increases.[36] Texas has the potential to generate 22,786,750 million kWh/year, more than any other state, from 7,743,000 MW of concentrated solar power plants, using 34% of Texas,[37] and 131,200 million kWh/year from 97,800 MW of rooftop photovoltaic panels, 34.6% of the electricity used in the state in 2013.[38]
Texas electricity consumption in 2010 was 358,458 million kWh, more than any other state, and 9.5% of the US total.[39]
See also
References
- ↑ Output data
- ↑ Accounts, Texas Comptroller of Public. "State Energy Conservation Office". www.seco.cpa.state.tx.us. Retrieved 23 April 2018.
- ↑ "Estimates of Windy Land Area and Wind Energy Potential, by State". windpoweringamerica.gov. Retrieved 23 April 2018.
- ↑ , OCI Solar Power
- ↑ "City of Austin Activates Largest Texas Solar Farm - CleanTechnica". cleantechnica.com. Retrieved 23 April 2018.
- ↑ "FAQ". cpsenergy.com. Retrieved 23 April 2018.
- ↑ "Blue Wing Solar Farm". juwisolar.com. Archived from the original on 26 April 2012. Retrieved 23 April 2018.
- ↑ "The Solar Power World Top 250: The Top Solar Contractors In Texas". www.solarpowerworldonline.com. Retrieved 23 April 2018.
- ↑ http://www.bizjournals.com/sanantonio/blog/2014/03/oci-s-alamo-2-solar-farm-begings-generating-energy.html
- ↑ "Phase 3 of 400 MW Alamo Solar Project in Texas Now Online - CleanTechnica". cleantechnica.com. Retrieved 23 April 2018.
- ↑ "Alamo 4 Solar - Solar - Mortenson". www.mortenson.com. Retrieved 23 April 2018.
- ↑ "ConEdison Development joins CPS Energy to dedicate Alamo 5 - CPS Energy Newsroom and Blog". cpsenergy.com. 12 April 2016. Retrieved 23 April 2018.
- 1 2 3 4 "EIA - Electricity Data". www.eia.gov. Retrieved 23 April 2018.
- ↑ http://investor.firstsolar.com/releasedetail.cfm?releaseid=869379
- ↑ Gold, Russell (21 August 2015). "Next Texas Energy Boom: Solar". Retrieved 23 April 2018 – via www.wsj.com.
- ↑ "The Blue Wing Solar Project: "Truly Utility Scale"". greentechmedia.com. Retrieved 23 April 2018.
- ↑ "BTU Adds Sunshine to Energy Sources". wtaw.com. 4 April 2013. Retrieved 23 April 2018.
- ↑ Energy, CPS. "New Energy Economy Project Boosts CPS Energy's Solar Power And Area Education". www.prnewswire.com. Retrieved 23 April 2018.
- ↑ "CPS dedicates solar complex". mysanantonio.com. Retrieved 23 April 2018.
- ↑ "Update and Erratum—Webberville: The Biggest Solar PV Installation in Texas". greentechmedia.com. Retrieved 23 April 2018.
- ↑ Sherwood, Larry (August 2012). "U.S. Solar Market Trends 2011" (PDF). Interstate Renewable Energy Council (IREC). p. 17. Archived from the original (PDF) on 2012-09-06. Retrieved 2012-08-16.
- ↑ Sherwood, Larry (June 2011). "U.S. Solar Market Trends 2010" (PDF). Interstate Renewable Energy Council (IREC). Retrieved 2011-06-29.
- ↑ Sherwood, Larry (July 2010). "U.S. Solar Market Trends 2009" (PDF). Interstate Renewable Energy Council (IREC). Archived from the original (PDF) on 2010-09-25. Retrieved 2010-07-28.
- ↑ Sherwood, Larry (July 2009). "U.S. Solar Market Trends 2008" (PDF). Interstate Renewable Energy Council (IREC). p. 16. Archived from the original (PDF) on 2009-11-23. Retrieved 2010-07-24.
- ↑ Sherwood, Larry (July 2012). "U.S. Solar Market Trends 2012" (PDF). Interstate Renewable Energy Council (IREC). p. 16. Retrieved 2013-10-11.
- ↑ "Texas Solar". SEIA. Retrieved 2016-04-23.
- ↑ "Electric Power Annual State Data" 1990-2016 Existing Name Plate and Summer Capacity by Energy Source and State retrieved 2018-7-17
- ↑ "Electric Power Monthly Data Browser" Table 1.17B retrieved 2018-3-15
- ↑ "Electric Power Monthly Data Browser " Report 1.14 retrieved 2017-6-17
- ↑ "Electric Power Monthly Data Browser " Report 1.13 retrieved 2017-6-17
- ↑ "Electric Power Monthly Data Browser " Report 1.6 retrieved 2017-6-17
- ↑ "Electric Power Annual" retrieved 2017 6 17
- ↑ "Electric Power Monthly" retrieved 2018 3 12
- ↑ "Texas' renewable energy resources". infinitepower.org. Archived from the original on 8 April 2012. Retrieved 23 April 2018.
- ↑ "US Energy Consumption". wilcoxen.maxwell.insightworks.com. Retrieved 23 April 2018.
- ↑ Makhijani, Arjun Carbon-Free and Nuclear-Free, A Roadmap for U.S. Energy Policy 2007 ISBN 978-1-57143-173-8
- ↑ "Renewable Energy Technical Potential". nrel.gov. Archived from the original on 15 September 2012. Retrieved 23 April 2018.
- ↑ "Rooftop Solar Photovoltaic Technical Potential in the United States: A Detailed Assessment" (PDF). nrel.gov. Retrieved 23 April 2018.
- ↑ Office of Energy Efficiency and Renewable Energy (2015-03-12). "Electric Power and Renewable Energy in Texas". United States Department of Energy. Retrieved 2016-04-25.
External links
| Wikimedia Commons has media related to Solar power in Texas. |