Solar power in Vermont provides only a small amount of the state's electricity . A 2009 study indicated that distributed solar on rooftops can provide 18% of all electricity used in Vermont.[1] A 2012 estimate suggests that a typical 5 kW system costing $25,000 before credits and utility savings will pay for itself in 10 years, and generate a profit of $34,956 over the rest of its 25-year life.[2]
Net metering is available for up to at least 500 kW generation, but is capped at 15% of utilities peak demand. Excess generation is rolled over each month but is lost once each year. Group net metering is also allowed.[3] Vermont is given an A for net metering and a C for interconnection.[4] A feed-in tariff was created in 2009, but is limited to 50 MW and is fully subscribed. The cap increases by 5 to 10 MW/year starting in 2013 until it reaches 127.5 MW in 2022. It is available for solar, wind, methane, and biomass.[5][6] Seven solar projects are receiving payments, of $0.30/kWh, for 25 years.[7]
Vermont has five solar arrays of at least 1 MW, the 2.2 MW SunGen Sharon 1 in Sharon completed in July 2012,[8] the 2.1 MW concentrating photovoltaics array installed in July 2011 in South Burlington,[9][10] the 1.5 MW photovoltaic array also in South Burlington installed in October 2011,[11] the 1 MW photovoltaic array in Ferrisburgh,[12] and the 2 MW Williamstown Solar Project.[13]
A proposed 20MW solar farm in Ludlow is opposed by Green Mountain Power and the governor. The power company claims that there is no need for any utility-scale solar in the state.[14]
Installed capacity
| Grid-Connected PV Capacity (MW)[16][17][18][19][20][21][22][23][24][25] |
|---|
| Year |
Capacity |
Change |
% Change |
| 2007 | 0.7 | 0.2 | 40% |
| 2008 | 1.1 | 0.4 | 57% |
| 2009 | 1.7 | 0.6 | 55% |
| 2010 | 3.9 | 2.2 | 129% |
| 2011 | 11.7 | 7.8 | 200% |
| 2012 | 28.0 | 16.3 | 139% |
| 2013 | 41.5 | 13.6 | 49% |
| 2014 | 64 | 22.5 | 54% |
| 2015 | 107 | 43 | 67% |
Generation
Using data available from the U.S. Energy Information Agency's Electric Power Annual 2016[26] and "Electric Power Monthly Data Browser",[27][28][29][30] the following table summarizes Vermonts’s solar energy posture.
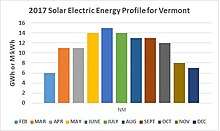
2017 VT Solar Energy Generation Profile
Capacity factor for each year was computed from the end-of-year summer capacity.
2017 data is from Electric Power Monthly and is subject to change.
Solar-electric generation in Vermont
| Year
| Facilities
| Summer capacity (MW)
| Electric energy (GWh or M kWh)
| Capacity factor
| Yearly growth of generating capacity
| Yearly growth of produced energy
| % of VT renewable electric energy
| % of VT generated electric energy
| % of U.S. Solar electric energy
|
|---|
| 2017
| 31 | 74.2 | 129 | 0.198 | 13% | 119% | 6.23% | 6.21% | 0.24%
|
| 2016
| | 65.7 | 59 | 0.103 | 118% | 23% | 3.10% | 3.08% | 0.16%
|
| 2015
| | 32.4 | 48 | 0.169 | 7% | 100% | 2.4% | 2.42% | 0.19%
|
| 2014
| | 30.2 | 24 | .091 | | 41% | 2.10% | 0.34% | 0.13%
|
|
A small scale 15KW installation at a homestead in middle Vermont generated 19,480 kWh of electrical energy at a Capacity Factor of 0.15. The homestead was sending energy to the utility when it was produced and taking energy from the utility when needed. Overall, the homestead consumed 80% of its generation and sold the remaining 20% to the utility. The generation profile is shown in the chart.
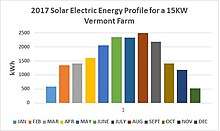
2017 15KW Vermont Farm Solar Energy Generation Profile
Beginning with the 2014 data year, the Energy Information Administration (EIA) has estimated the distributed solar-photovoltaic generation and distributed solar-photovoltaic capacity.[31] These non-utility-scale appraisals evaluate that Vermont generated the following amounts of additional solar energy:
Estimated distributed solar electric generation in Vermont[32][33]
| Year |
Summer capacity (MW) |
Electric energy (GWh or M kWh) |
|---|
| 2017 |
89 | 110 |
| 2016 |
59.8 | 76 |
| 2015 |
49.9 | 48 |
| 2014 |
27.9 | 33 |
Specific solar farm data follows:
2.597 MW fixed tilt Barton Solar Farm generation (kWh)[7]
| Year | January | February | March | April | May | June | July | August | September | October | November | December | Total |
|---|
| 2014 | | | | | | | | | | | 2,283 | 34,522 | 36,805 |
| 2015 | 42,153 | 18,082 | 233,572 | 267,032 | 372,320 | 354,479 | 380,525 | 351,880 | 326,723 | 210,548 | 138,288 | 59,410 | 2,755,012 |
| 2016 | 53,732 | 101,948 | 251,409 | | | | | | | | | | 407,089 |
| Total | | 3,198,906 |
2.2 MW 15° fixed tilt Champlain Valley Solar Farm generation (kWh)[7]
| Year | January | February | March | April | May | June | July | August | September | October | November | December | Total |
|---|
| 2015 | | | | | | | 108,347 | 249,021 | 360,222 | 265,585 | 200,987 | 98,580 | 1,282,742 |
| 2016 | 77,601 | 122,304 | 281,687 | | | | | | | | | | 481,592 |
| Total | | 1,764,334 |
2.4 MW (2 MW AC) fixed tilt Chester Solar Farm generation (kWh)[7]
| Year | January | February | March | April | May | June | July | August | September | October | November | December | Total |
|---|
| 2014 | | | | | | | | | | | | 57,759 | 57,759 |
| 2015 | 42,315 | 16,759 | 209,274 | 264,691 | 240,143 | 283,030 | 325,057 | 321,341 | 280,149 | 230,717 | 175,196 | 83,384 | 2,472,056 |
| 2016 | 123,410 | 148,742 | 253,174 | | | | | | | | | | 525,326 |
| Total | | 3,055,141 |
2.2 MW dual axis tracking Claire Solar Farm generation (kWh)[7]
| Year | January | February | March | April | May | June | July | August | September | October | November | December | Total |
|---|
| 2014 | | | | | | | | | | | 130,850 | 103,416 | 234,266 |
| 2015 | 152,048 | 165,820 | 332,192 | 366,615 | 446,376 | 418,882 | 455,352 | 414,911 | 367,641 | 251,605 | 194,385 | 78,083 | 3,643,910 |
| 2016 | 147,394 | 170,433 | 309,100 | | | | | | | | | | 626,927 |
| Total | | 4,505,103 |
2 MW (AC) fixed tilt Clarendon Solar Project generation (kWh)[7]
| Year | January | February | March | April | May | June | July | August | September | October | November | December | Total |
|---|
| 2014 | | | | | | | 301,303 | 335,058 | 306,499 | 178,405 | 122,241 | 83,373 | 1,326,879 |
| 2015 | 96,300 | 97,945 | 270,681 | 278,804 | 354,004 | 328,733 | 361,781 | 359,061 | 323,554 | 240,268 | 197,673 | 104,831 | 3,013,635 |
| 2016 | 149,878 | 143,090 | 266,066 | | | | | | | | | | 559,034 |
| Total | | 4,899,548 |
2 MW (AC) fixed tilt Coventry Solar Project generation (kWh)[7]
| Year | January | February | March | April | May | June | July | August | September | October | November | December | Total |
|---|
| 2014 | | | | | | | | | 330,116 | 202,364 | 89,553 | 60,542 | 682,575 |
| 2015 | 72,032 | 4,848 | 178,931 | 317,191 | 387,374 | 359,905 | 392,978 | 366,215 | 350,035 | 248,943 | 155,426 | 71,027 | 2,904,905 |
| 2016 | 84,779 | 140,603 | 266,066 | | | | | | | | | | 491,448 |
| Total | | 4,078,928 |
1 MW fixed tilt Ferrisburgh generation (kWh)[7][34]
| Year | January | February | March | April | May | June | July | August | September | October | November | December | Total |
|---|
| 2010 | | | | | | | | | | | | 25,234 | 25,234 |
| 2011 | 33,369 | 56,396 | 134,873 | 115,728 | 126,312 | 141,528 | 168,590 | 136,755 | 127,040 | 89,381 | 75,377 | 64,207 | 1,269,556 |
| 2012 | 54,200 | 99,123 | 124,243 | 141,875 | 149,987 | 159,116 | 172,179 | 157,429 | 125,141 | 76,049 | 81,109 | 38,388 | 1,378,839 |
| 2013 | 49,832 | 71,062 | 103,822 | 142,788 | 155,750 | 133,042 | 151,457 | 151,357 | 138,927 | 94,205 | 81,126 | 25,208 | 1,298,576 |
| 2014 | 62,535 | 80,093 | 122,697 | 135,764 | 144,689 | 149,194 | 155,393 | 150,523 | 140,847 | 84,005 | 63,143 | 47,421 | 1,336,304 |
| 2015 | 67,304 | 57,224 | 129,006 | 138,137 | 164,962 | 147,367 | 164,337 | 160,370 | 142,472 | 110,303 | 80,006 | 40,178 | 1,401,666 |
| 2016 | 56,057 | 74,093 | 116,415 | | | | | | | | | | 246,565 |
| Total | | 6,956,740 |
2.96 MW fixed tilt Limerick Road Solar Farm generation (kWh)[7]
| Year | January | February | March | April | May | June | July | August | September | October | November | December | Total |
|---|
| 2014 | | 143,283 | 302,752 | 349,450 | 408,968 | 415,763 | 417,116 | 400,982 | 367,301 | 206,457 | 129,759 | 104,784 | 3,246,615 |
| 2015 | 173,705 | 89,761 | 344,700 | 356,793 | 423,377 | 402,312 | 431,826 | 399,128 | 369,191 | 265,299 | 188,618 | 98,782 | 3,543,492 |
| 2016 | 157,178 | 142,184 | 314,958 | | | | | | | | | | 614,320 |
| Total | | 7,404,427 |
2.2 MW (AC) fixed tilt Sheldon Springs Solar generation (kWh)[7]
| Year | January | February | March | April | May | June | July | August | September | October | November | December | Total |
|---|
| 2013 | | | | | | | | | | 163,563 | 106,354 | 46,225 | 316,142 |
| 2014 | 96,439 | 177,357 | 252,833 | 282,338 | 247,703 | 327,458 | 307,030 | 297,535 | 289,377 | 170,249 | 110,910 | 74,394 | 2,633,623 |
| 2015 | 68,947 | 106,711 | 281,187 | 279,562 | 340,301 | 331,230 | 347,405 | 349,903 | 309,172 | 215,892 | 139,514 | 58,729 | 2,828,553 |
| 2016 | 86,921 | 111,006 | 266,421 | | | | | | | | | | 464,348 |
| Total | | 6,242,666 |
2.130 MW dual axis tracking South Burlington Solar Farm generation (kWh)[7]
| Year | January | February | March | April | May | June | July | August | September | October | November | December | Total |
|---|
| 2011 | | | | | | 244,684 | 446,839 | 355,547 | 298,142 | 200,576 | 163,960 | 121,541 | 1,831,289 |
| 2012 | 88,165 | 223,306 | 311,089 | 327,782 | 376,112 | 427,720 | 470,300 | 398,723 | 342,073 | 177,785 | 171,268 | 73,913 | 3,388,236 |
| 2013 | 110,132 | 158,350 | 259,135 | 323,186 | 398,593 | 342,079 | 398,939 | 384,244 | 311,970 | 213,894 | 154,758 | 65,348 | 3,120,628 |
| 2014 | 148,701 | 212,791 | 282,233 | 314,116 | 379,219 | 422,849 | 400,390 | 360,539 | 325,255 | 173,608 | 120,763 | 87,096 | 3,227,560 |
| 2015 | 144,288 | 188,949 | 322,022 | 335,103 | 404,573 | 376,422 | 421,317 | 378,240 | 331,775 | 227,702 | 173,307 | 69,819 | 3,373,517 |
| 2016 | 136,367 | 155,539 | 292,557 | | | | | | | | | | 584,463 |
| Total | | 15,525,693 |
2.2 MW fixed tilt Southern Vermont Energy Park solar generation (kWh)[7]
| Year | January | February | March | April | May | June | July | August | September | October | November | December | Total |
|---|
| 2012 | | | | | | | | | | | | 84,161 | 84,161 |
| 2013 | 159,783 | 173,281 | 227,341 | 304,241 | 323,422 | 297,834 | 319,004 | 296,161 | 306,550 | 221,959 | 189,433 | 76,128 | 2,895,137 |
| 2014 | 157,092 | 152,204 | 265,162 | 248,732 | 294,583 | 290,899 | 338,331 | 315,905 | 311,017 | 170,226 | 122,108 | 78,523 | 2,744,782 |
| 2015 | 131,006 | 182,363 | 272,022 | 253,885 | 334,770 | 307,140 | 355,227 | 364,144 | 322,860 | 244,182 | 198,686 | 101,695 | 3,067,980 |
| 2016 | 166,388 | 195,836 | 298,828 | | | | | | | | | | 661,052 |
| Total | | 9,453,112 |
2.130 MW dual axis tracking St Albans Solar Farm generation (kWh)[7]
| Year | January | February | March | April | May | June | July | August | September | October | November | December | Total |
|---|
| 2013 | | | | | | | | | | | 76,225 | 43,347 | 119,572 |
| 2014 | 78,820 | 95,318 | 247,998 | 298,935 | 367,216 | 391,940 | 386,239 | 363,182 | 315,772 | 179,754 | 101,528 | 52,788 | 2,879,490 |
| 2015 | 48,378 | 15,652 | 295,229 | 314,182 | 384,267 | 373,847 | 391,216 | 386,599 | 339,096 | 223,144 | 119,906 | 45,598 | 2,937,114 |
| 2016 | 73,767 | 82,744 | 283,832 | | | | | | | | | | 440,343 |
| Total | | 6,376,519 |
2.2 MW fixed tilt SunGen Sharon generation (kWh)[7]
| Year | January | February | March | April | May | June | July | August | September | October | November | December | Total |
|---|
| 2012 | | | | | | | | 291,536 | 251,252 | 141,742 | 146,717 | 59,795 | 891,042 |
| 2013 | 81,010 | 103,008 | 208,807 | 257,346 | 288,636 | 281,957 | 304,840 | 309,871 | 354,830 | 173,428 | 157,957 | 44,817 | 2,566,507 |
| 2014 | 119,447 | 106,083 | 208,960 | 337,259 | 336,858 | 368,353 | 375,237 | 341,780 | 293,615 | 179,531 | 106,704 | 51,449 | 2,825,276 |
| 2015 | 95,989 | 54,009 | 260,840 | 296,375 | 360,884 | 349,691 | 382,944 | 364,598 | 293,377 | 224,871 | 184,715 | 88,653 | 2,956,946 |
| 2016 | 112,867 | 149,618 | 260,544 | | | | | | | | | | 523,029 |
| Total | | 9,762,800 |
2.2 MW (AC) fixed tilt Technology Drive Solar generation (kWh)[7]
| Year | January | February | March | April | May | June | July | August | September | October | November | December | Total |
|---|
| 2014 | | | | | | | | | 73,650 | 181,716 | 126,734 | 95,293 | 477,393 |
| 2015 | 26,577 | 3,826 | 254,844 | 296,799 | 403,213 | 339,704 | 375,881 | 360,579 | 304,769 | 233,311 | 162,018 | 76,542 | 2,838,063 |
| 2016 | 145,346 | 174,998 | 303,787 | | | | | | | | | | 624,131 |
| Total | | 3,939,587 |
3.6 MW fixed tilt Whitcomb Farm Solar generation (kWh)[35][7]
| Year | January | February | March | April | May | June | July | August | September | October | November | December | Total |
|---|
| 2014 | | | | | | | | | | 17,657 | 131,350 | 90,146 | 239,153 |
| 2015 | 84,114 | 65,460 | 371,751 | 409,124 | 446,622 | 459,223 | 506,489 | 473,532 | 419,565 | 299,021 | 211,618 | 89,414 | 3,835,933 |
| 2016 | 94,938 | 158,824 | 350,141 | | | | | | | | | | 603,903 |
| Total | | 4,678,989 |
2.166 MW (AC) fixed tilt White River Junction Solar Farm generation (kWh)[7]
| Year | January | February | March | April | May | June | July | August | September | October | November | December | Total |
|---|
| 2012 | | | | | | | | | | 79,857 | 198,037 | 93,176 | 371,070 |
| 2013 | 117,776 | 172,621 | 263,185 | 349,969 | 366,581 | 335,279 | 356,356 | 368,425 | 326,301 | 227,760 | 192,711 | 66,500 | 3,143,464 |
| 2014 | 171,235 | 175,112 | 281,547 | 344,922 | 342,107 | 377,409 | 373,716 | 363,257 | 319,198 | 205,203 | 144,504 | 99,129 | 3,197,339 |
| 2015 | 158,081 | 123,034 | 317,280 | 316,782 | 397,837 | 349,473 | 377,662 | 370,192 | 328,015 | 256,058 | 219,090 | 100,342 | 3,313,846 |
| 2016 | 169,381 | 208,070 | 296,739 | | | | | | | | | | 674,190 |
| Total | | 10,699,909 |
2.0 MW Williamstown Solar Project generation (kWh)[7]
| Year | January | February | March | April | May | June | July | August | September | October | November | December | Total |
|---|
| 2012 | | | | | | | | | | | | 43,159 | 43,159 |
| 2013 | 46,254 | 28,541 | 195,539 | 283,670 | 340,484 | 286,397 | 331,462 | 350,358 | 310,678 | 216,175 | 127,224 | 44,522 | 2,561,304 |
| 2014 | 80,023 | 49,408 | 168,005 | 290,858 | 236,033 | 289,530 | 307,128 | 315,700 | 292,625 | 181,512 | 88,252 | 43,952 | 2,343,026 |
| 2015 | 21,296 | 1,791 | 217,432 | 271,501 | 358,738 | 296,162 | 368,317 | 346,472 | 322,967 | 240,280 | 162,739 | 87,279 | 2,694,974 |
| 2016 | 67,449 | 114,092 | 258,083 | | | | | | | | | | 439,624 |
| Total | | 8,082,087 |
References
- ↑ Witkin, Jim (2009-10-30). "Report Argues for a Decentralized System of Renewable Power Generation". Green Blog.
- ↑ "Guide to Vermont Home Solar Incentives, Rebates, and Tax Credits". Solar Power Rocks.
- ↑ Vermont Net Metering Archived 2012-05-10 at the Wayback Machine.
- ↑ Freeing the grid Archived 2012-06-16 at the Wayback Machine.
- ↑ Standard Offer Program Archived 2012-07-27 at the Wayback Machine.
- ↑ Standard Offer for Qualifying SPEED Resources Archived 2012-05-27 at the Wayback Machine.
- 1 2 3 4 5 6 7 8 9 10 11 12 13 14 15 16 17 18 Monthly Production Archived 2012-07-27 at the Wayback Machine.
- ↑ "Talmage Solar Engineering, Inc. Unveils Largest Smart Array in North America". Business Wire. 2012-07-31.
- ↑ Griset, Todd (2011-07-28). "Vermont's largest solar array compared to California's". Energy Policy Update.
- ↑ "Site #316 Production Report | AllEarth Renewables Energy Production Report". www.allearthrenewables.com.
- ↑ Military Invests in Solar at Vermont National Guard Base Archived 2012-07-26 at the Wayback Machine.
- ↑ Ferrisburgh Solar Farm
- ↑ "Williamstown solar array to be among state's biggest". Rutland Herald. 2012-07-31. Archived from the original on 2013-04-11.
- ↑ Polhamus, Mike (2015-12-06). "20-megawatt solar project needed, developers' report says". VTDigger.
- ↑ "PV Watts". NREL. Retrieved 23 July 2012.
- ↑ Sherwood, Larry (August 2012). "U.S. Solar Market Trends 2011" (PDF). Interstate Renewable Energy Council (IREC). Archived from the original (PDF) on 2012-09-06. Retrieved 2012-08-16.
- ↑ Sherwood, Larry (June 2011). "U.S. Solar Market Trends 2010" (PDF). Interstate Renewable Energy Council (IREC). Retrieved 2011-06-29.
- ↑ Sherwood, Larry (July 2010). "U.S. Solar Market Trends 2009" (PDF). Interstate Renewable Energy Council (IREC). Archived from the original (PDF) on 2010-09-25. Retrieved 2010-07-28.
- ↑ Sherwood, Larry (July 2009). "U.S. Solar Market Trends 2008" (PDF). Interstate Renewable Energy Council (IREC). Archived from the original (PDF) on 2009-11-23. Retrieved 2010-07-24.
- ↑ Sherwood, Larry (August 2008). "U.S. Solar Market Trends 2007" (PDF). Interstate Renewable Energy Council (IREC). Retrieved 2010-07-24.
- ↑ US Solar Market Insight Report Archived 2012-04-18 at the Wayback Machine.
- ↑ Sherwood, Larry (July 2009). "U.S. Solar Market Trends 2008" (PDF). Interstate Renewable Energy Council (IREC). p. 16. Archived from the original (PDF) on 2009-11-23. Retrieved 2010-07-24.
- ↑ Sherwood, Larry (July 2012). "U.S. Solar Market Trends 2012" (PDF). Interstate Renewable Energy Council (IREC). p. 16. Retrieved 2013-10-11.
- ↑ Sherwood, Larry (July 2014). "U.S. Solar Market Trends 2013" (PDF). Interstate Renewable Energy Council (IREC). Retrieved 2014-09-26.
- ↑ Vermont Solar
- ↑ "Electric Power Annual State Data" 1990-2016 Existing Name Plate and Summer Capacity by Energy Source and State retrieved 2018-7-17
- ↑ "Electric Power Monthly Data Browser" Table 1.17B retrieved 2018-3-15
- ↑ "Electric Power Monthly Data Browser " Report 1.14 retrieved 2017-6-17
- ↑ "Electric Power Monthly Data Browser " Report 1.13 retrieved 2017-6-17
- ↑ "Electric Power Monthly Data Browser " Report 1.6 retrieved 2017-6-17
- ↑ "Electric Power Annual" retrieved 2017 6 17
- ↑ "Electric Power Monthly" |title=Electric Power Monthly (February 2018 with data for December 2017) - Table 1.17.B. Net Generation from Solar Photovoltaic retrieved 2018 5 29
- ↑ "Electric Power Monthly" |title=Electric Power Monthly (February 2018 with data for December 2017) - Table 6.2.B. Net Capacity from Solar Photovoltaic retrieved 2018 7 27
- ↑ Ferrisburgh Solar Farm Archived 2016-06-03 at the Wayback Machine.
- ↑ "Vermont's largest solar array installed in Essex Jct | Vermont Business Magazine". www.vermontbiz.com. 2015-01-25.
External links
|
|---|
|
| By state | |
|---|
| Power plants | | Current | |
|---|
Planned and
under construction | |
|---|
|
|---|
| Companies | |
|---|
| Organizations | |
|---|
Residential
solar power | |
|---|
|
|
|---|
| Politics and law | |
|---|
| Energy by state | |
|---|
| Sources | |
|---|
| Environmental issues | |
|---|
| Governmental Agencies | |
|---|
| Organizations | |
|---|
- Energy portal
- Sustainable development portal
|