Wind power in Kansas

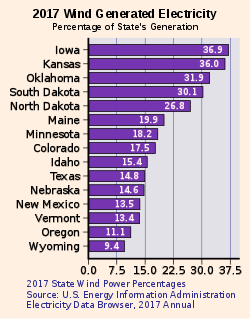
The U.S. State of Kansas has high potential capacity for wind power, second behind Texas. The most recent estimates (2012) are that Kansas has a potential for 952 GW of wind power capacity yet has only about 1.2 GW installed. Kansas could generate 3,102 TW·h of electricity each year,[1] which represents over 75% of all the electricity generated in the United States in 2011.[2] This electricity could be worth $290 billion per year (at 9.35 cents per kW·h[3]). Kansas generated 29.6% of its electricity with wind in 2016.[4]
Growth
| Year | Capacity (MW)[5] | Generation (GWh)[6] |
|---|---|---|
| 1999 | 2 | |
| 2000 | 2 | |
| 2001 | 114 | 39.8 |
| 2002 | 114 | 466.7 |
| 2003 | 114 | 365.9 |
| 2004 | 114 | 358.6 |
| 2005 | 264 | 425.8 |
| 2006 | 364 | 991.9 |
| 2007 | 364 | 1,152.5 |
| 2008 | 921 | 1,759.4 |
| 2009 | 1021 | 2,863.3 |
| 2010 | 1074 | 3,405.1 |
| 2011 | 1224 | 3,759 |
| 2012 | 2712 | 5,119 |
| 2013 | 2967 | 9,433 |
| 2014 | 2967 | 10,844 |
| 2015 | 3766 | |
| 2016 | 4451 | |
| 2017 | 4931 |
Kansas has led the nation over the past decade in all measured categories of scaling up renewable electricity generation with an overall growth in generation of 1,678.5% from 2001-2007.[7] This rapid overall growth in renewable energy generation represents an equally large increase of 1,487.9%, as a percent of total state electricity generation. Massive increases in generation are largely the product of wind energy development across the state. In 2001, Kansas had 114 Megawatts (MW) of wind energy generation. By the end of 2011, Kansas had installed 1,224 MW of generation.[8] Wind energy generation in Kansas grew 2,793.5% from 2001-2007. This amounts to an average growth of slightly over 75% per year.[9]
Potential
Being centrally located in the midwest, Kansas is squarely placed in the center of America’s wind tunnel, a corridor stretching from North Dakota south into the Texas panhandle, where the vast majority of the nation’s best on-shore wind resources are located.[10] Kansas has the 2nd highest wind potential in the U.S. with an estimated over 952,000 MW possible capacity, capable of generating over 3,101,576 GWh. Texas has the largest wind potential.[1]
With a projected total state peak load of 10,000 MW, Kansas could become a major wind energy exporting state to the south and the east U.S. where renewable generation opportunities are much more constrained.[11]
The Department of Energy’s National Renewable Energy Lab (NREL) projects that if Kansas were to develop 7,158 MW of new wind by 2030 the economic impact for Kansas would total over $7.8 billion in benefit to local economies, landowners, and job creation, creating over 26,000 new jobs.[7]
In 2007 Kansas Governor Sebelius noted in her State of the State address that “our goal is to produce 10 percent of our state’s electricity from wind power by 2010, and 20 percent by 2020.”[12]
Wind power accounted for 19.4% of the electricity generated in Kansas during 2013.[13]
Economic benefits
Forecasts indicate that for every 1,000 MW of wind developed in Kansas, cumulative economic benefits will be $1.08 billion, with annual CO2 reduction estimated at 3.2 million tons, and annual water savings at 1,816 million gallons. These projected benefits could be greatly increased by developing more localized manufacturing, installation, supply and maintenance industry within the State.[14] In the 6 years leading up to 2008, Kansas lost 10,944 manufacturing jobs totaling 6% of the manufacturing workforce.[11] It is estimated that the potential manufacturing benefit for Kansas lies mostly in the southeastern part of the state. Up to 2008, southeastern Kansas experienced the majority of high unemployment rates in the state (i.e., >6%).[15]
Education
Cloud County Community College has a wind energy technology program in Concordia. CCCC is the only college in the state of Kansas with an AWEA-certified wind energy program and only one of seven in the entire United States. They are located just two miles north of the Meridian Way wind farm.
Wind generation
| Kansas Wind Generation (GWh, Million kWh) | |||||||||||||
|---|---|---|---|---|---|---|---|---|---|---|---|---|---|
| Year | Total | Jan | Feb | Mar | Apr | May | Jun | Jul | Aug | Sep | Oct | Nov | Dec |
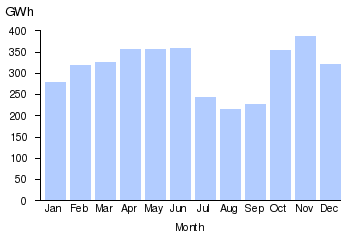
| 2011 | 3,759 | 278 | 319 | 327 | 356 | 356 | 358 | 243 | 215 | 218 | 355 | 386 | 322 |
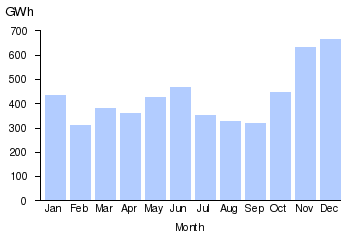
| 2012 | 5,119 | 433 | 309 | 379 | 359 | 425 | 467 | 354 | 326 | 321 | 446 | 631 | 665 |
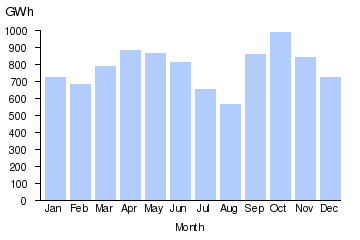
| 2013 | 9,431 | 728 | 688 | 789 | 887 | 870 | 817 | 658 | 568 | 863 | 993 | 845 | 725 |
| 2014 | |||||||||||||
| 2015 | |||||||||||||
| 2016 | |||||||||||||
| 2017 | 1,468 | ||||||||||||
| 2018 | 10,698 | 1,894 | |||||||||||
|
| ||
|
See also
References
- 1 2 National Renewable Energy Laboratory (2012-07-04). "U.S. Renewable Energy Technical Potentials" (PDF). U.S. Department of Energy. p. 14.
- ↑ Net Generation by Energy Source
- ↑ Average Retail Cost of Electricity in the United States
- ↑ "Kansas Wind Energy" (PDF). U.S. Wind Energy State Facts. American Wind Energy Association. Retrieved 27 December 2017.
- ↑ U.S. Installed Wind Capacity
- ↑ "Generation Annual". U.S. Department of Energy. July 10, 2012. Retrieved August 6, 2012.
- 1 2 "State of the States 2009: Renewable Energy Development and the Role of Policy" (PDF). National Renewable Energy Lab.
- ↑ "US Installed Wind Capacity 2004-2010". National Renewable Energy Lab. Retrieved 12 May 2011.
- ↑ "State of the States 2009: Renewable Energy Development and the Role of Policy" (PDF). National Renewable Energy Lab. p. 39.
- ↑ "80 Meter Wind Map". National Renewable Energy Lab. Department of Energy. Retrieved 12 May 2011.
- 1 2 "20 GW Study for Kansas" (PDF). American Council on Renewable Energy. Retrieved 12 May 2011.
- ↑ "A Closer Look at Wind for the State". Kansas Energy. Kansas Lt. Governor Mark Parkinson. Retrieved 12 May 2011.
- ↑ "American wind power reaches major power generation milestones in 2013". American Wind Energy Association. March 5, 2014.
- ↑ "Economic Benefits of Wind Energy in Kansas" (PDF). Wind Power America. Department of Energy. Retrieved 11 May 2011.
- ↑ "Domestic Manufacturing: Kansas' Future in the Renewable Energy Industry". Renewable Energy Policy Project. Center for Renewable Energy and Sustainable Technology. Retrieved 10 May 2011.
- ↑ EIA (July 27, 2012). "Electric Power Monthly Table 1.17.A." United States Department of Energy. Retrieved 2012-08-15.
- ↑ EIA (July 27, 2012). "Electric Power Monthly Table 1.17.B." United States Department of Energy. Retrieved 2012-08-15.
External links
| Wikimedia Commons has media related to Wind power in Kansas. |
| Wind power by state |
| |
|---|---|---|
| Large wind farms | ||
| Wind power companies | ||
| ||