United Kingdom general election, 1950
|
| |||||||||||||||||||||||||||||||||||||||||||||
| |||||||||||||||||||||||||||||||||||||||||||||
All 625 seats in the House of Commons 313 seats needed for a majority | |||||||||||||||||||||||||||||||||||||||||||||
|---|---|---|---|---|---|---|---|---|---|---|---|---|---|---|---|---|---|---|---|---|---|---|---|---|---|---|---|---|---|---|---|---|---|---|---|---|---|---|---|---|---|---|---|---|---|
| Opinion polls | |||||||||||||||||||||||||||||||||||||||||||||
| Turnout |
83.9%, | ||||||||||||||||||||||||||||||||||||||||||||
| |||||||||||||||||||||||||||||||||||||||||||||
 Colours denote the winning party | |||||||||||||||||||||||||||||||||||||||||||||
| |||||||||||||||||||||||||||||||||||||||||||||
.jpg)
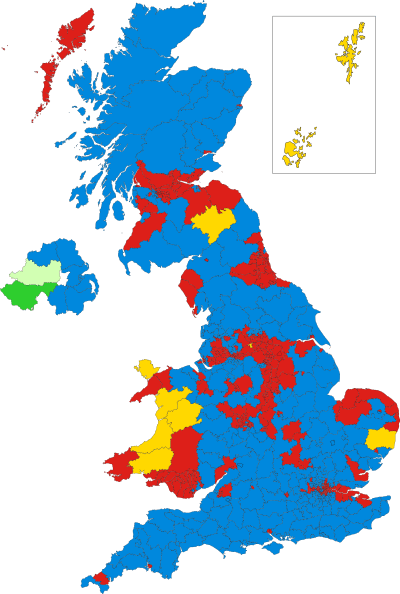
The 1950 United Kingdom general election was the first ever general election to be held after a full term of Labour government. The election was held on Thursday 23 February 1950. Despite polling over 700,000 votes more than the Conservatives,[lower-alpha 2] and receiving more votes than they had during the 1945 general election,[1] Labour obtained a slim majority of just five seats—a stark contrast to 1945, when they had achieved a comfortable 146-seat majority.[2] There was a national swing towards the Conservatives, whose performance in terms of popular vote was dramatically better than in 1945. Labour called another general election in 1951.
Turnout increased to 83.9%, the highest turnout in a UK general election under universal suffrage.
It was also the first general election to be covered on television, although the footage was not recorded. Richard Dimbleby anchored for the BBC Television coverage of the election, which he would later do again for the 1951, 1955, 1959 and the 1964 general elections. On this occasion, Dimbleby was joined in the BBC Lime Grove Studios by R. B. McCallum, Fellow of Pembroke College, Oxford, and author of The British General Election of 1945 and David Butler, research student of Nuffield College. The first ever election night programme ran from 10:45 pm until just after 1:00 am.[3]
Background
Significant changes since the 1945 general election included the abolition of plural voting by the Representation of the People Act 1948, and a major reorganisation of constituencies by the House of Commons (Redistribution of Seats) Act 1949. Eleven new English seats were created and six were abolished, and there were over 170 major alterations to constituencies across the country.
Campaign
Both the Conservative and Labour parties entered the campaign positively.
The Conservatives, having recovered from their landslide election defeat in 1945, accepted most of the nationalisation that had taken place under the Attlee government, which included the NHS and the mixed economy. The campaign essentially focused on the possible future nationalisation of other sectors and industries, which was supported by the Labour Party, and opposed by the Conservatives. The Liberals essentially viewed the struggle between the two parties on this issue as a class struggle.[4]
The Liberal Party fielded 475 candidates, more than at any general election since 1929. Liberal Party leader Clement Davies felt that the party had been at a disadvantage at the 1945 general election when they ran fewer candidates than needed to form a government. Davies arranged for the cost of running extra candidates to be offset by the party taking out insurance with Lloyd's of London against more than fifty candidates losing their deposits.
In the event, the strategy only succeeded in causing a very marginal increase in the overall Liberal vote over the previous election (albeit it was still their best popular vote percentage since 1929); the number of votes-per-candidate declined sharply, resulting in them losing a further three seats from their already-disappointing 1945 showing. A total of 319 Liberal candidates lost their deposits, a record number[5] until 2015, when candidates for the Liberal Democrats lost 335 deposits at the general election held in that year.[6]
Results
| 315 | 298 | 12 |
| Labour | Conservative | O |
The Labour Party won an overall majority of 5 seats, down from 146 in the previous election.
Prominent personalities entering Parliament in this election included Edward Heath, Enoch Powell, Reginald Maudling, Iain Macleod and Tony Benn.
| Candidates | Votes | ||||||||||
|---|---|---|---|---|---|---|---|---|---|---|---|
| Party | Leader | Stood | Elected | Gained | Unseated | Net | % of total | % | No. | Net % | |
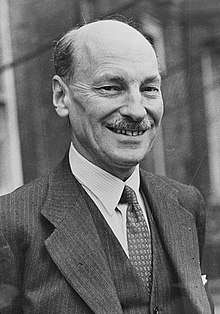
| Labour | Clement Attlee | 617 | 315 | −78 | 50.4 | 46.1 | 13,266,176 | −1.6 | |||
| Conservative | Winston Churchill | 495 | 298 | +90 | 47.7 | 43.4 | 12,492,404 | +4.3 | |||
| Liberal | Clement Davies | 475 | 9 | 3 | 6 | −3 | 1.4 | 9.1 | 2,621,487 | +0.1 | |
| Communist | Harry Pollitt | 100 | 0 | 0 | 2 | −2 | 0.3 | 91,765 | −0.1 | ||
| Nationalist | James McSparran | 2 | 2 | 0 | 0 | 0 | 0.3 | 0.2 | 65,211 | −0.2 | |
| Irish Labour | William Norton | 2 | 0 | 0 | 0 | 0 | 0.2 | 52,715 | N/A | ||
| Independent | N/A | 15 | 0 | 0 | 0 | 0 | 0.2 | 50,299 | −0.4 | ||
| Independent Labour | N/A | 6 | 0 | 0 | 0 | 0 | 0.1 | 26,395 | −0.2 | ||
| Ind. Conservative | N/A | 3 | 0 | 0 | 0 | 0 | 0.1 | 24,732 | −0.1 | ||
| Sinn Féin | Paddy McLogan | 2 | 0 | 0 | 0 | 0 | 0.1 | 23,362 | N/A | ||
| Plaid Cymru | Gwynfor Evans | 7 | 0 | 0 | 0 | 0 | 0.1 | 17,580 | +0.1 | ||
| Independent Liberal | N/A | 2 | 1 | 0 | 1 | −1 | 0.2 | 0.1 | 15,066 | ||
| SNP | Robert McIntyre | 3 | 0 | 0 | 0 | 0 | 0.0 | 9,708 | −0.1 | ||
| Anti-Partition | James McSparran | 4 | 0 | 0 | 0 | 0 | 0.1 | 5,084 | N/A | ||
| Ind. Labour Party | David Gibson | 4 | 0 | 0 | 3 | −3 | 0.0 | 4,112 | −0.2 | ||
| Independent Liberal and Conservative | N/A | 1 | 0 | 0 | 0 | 0 | 0.0 | 1,551 | N/A | ||
| National Independent | N/A | 1 | 0 | 0 | 2 | −2 | 0.0 | 1,380 | −0.3 | ||
| Mudiad Gweriniaethol Cymru | N/A | 1 | 0 | 0 | 0 | 0 | 0.0 | 613 | N/A | ||
| Social Credit | John Hargrave | 1 | 0 | 0 | 0 | 0 | 0.0 | 551 | N/A | ||
| United Socialist | Guy Aldred | 1 | 0 | 0 | 0 | 0 | 0.0 | 485 | |||
| Socialist (GB) | N/A | 2 | 0 | 0 | 0 | 0 | 0.0 | 448 | |||
Votes summary
Seats summary
See also
Notes
- ↑ Conservatives, Unionists and UUP 197 seats, 36.2%; National Liberals 11 seats, 2.9%.
- ↑ Including allies of the Conservatives such as the Unionists and the National Liberals.
- ↑ All parties shown. Conservative total includes Liberal National Party, (Scottish) Unionists and Ulster Unionists.
References
- ↑ 1950: Labour limps home, BBC News, retrieved 13 May 2018
- ↑ 1945: Labour landslide buries Churchill, BBC News, retrieved 13 May 2018
- ↑ General Election Results (1375), 17 February 1950, p. 47, retrieved 27 March 2018 – via BBC Genome
- ↑ 1950: Labour majority slashed, BBC News, 5 April 2005, retrieved 13 May 2018
- ↑ De Groot 1993.
- ↑ Archived copy, archived from the original on 8 December 2015, retrieved 27 November 2015
- ↑ Voter turnout at UK general elections 1945–2015, UK Political Info
Sources
- Craig, F. W. S. (1989), British Electoral Facts: 1832–1987, Dartmouth: Gower, ISBN 0900178302
- De Groot, Gerard J. (1993), Liberal Crusader: The Life of Sir Archibald Sinclair, C. Hurst & Co. Publishers, ISBN 978-1-85065-182-6
- Nicholas, H. (1951). The British general election of 1950. London: Macmillan. ISBN 0-333-77865-0.
External links
Manifestos
- This is the Road: The Conservative and Unionist Party's Policy, 1950 Conservative Party manifesto
- Let Us Win Through Together: A Declaration of Labour Policy for the Consideration of the Nation, 1950 Labour Party manifesto
- No Easy Way: Britain's Problems and the Liberal Answers, 1950 Liberal Party manifesto
| General elections |
|
|---|---|
| Local elections |
|
| European elections | |
| Referendums | |