Bratunac
| Bratunac Братунац | ||
|---|---|---|
| Town and municipality | ||
| ||
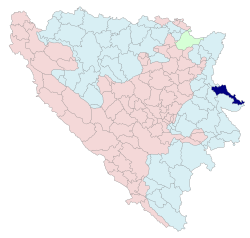 Location of Bratunac within Bosnia and Herzegovina | ||
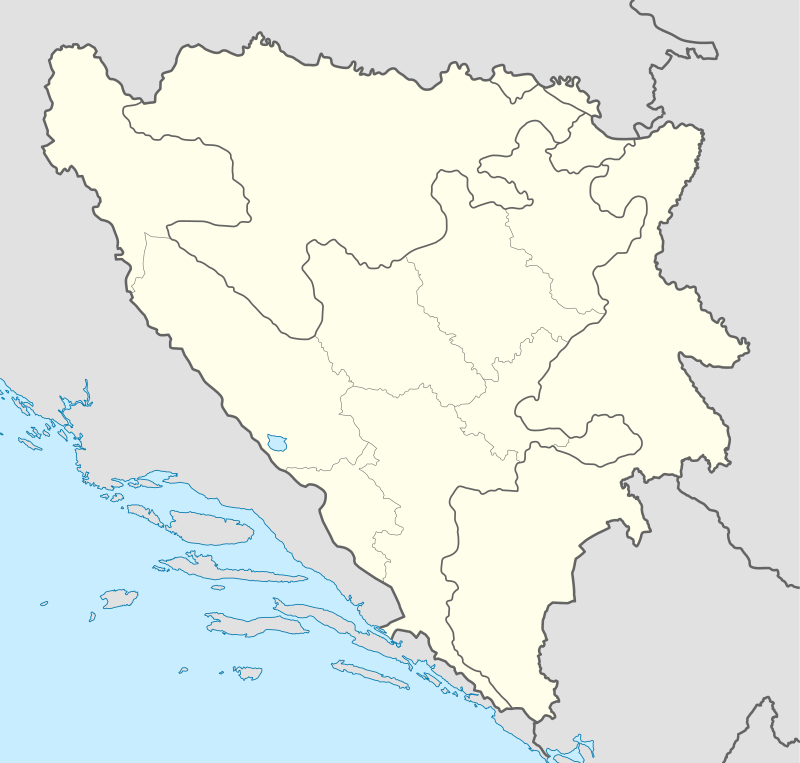 Bratunac Location within Bosnia and Herzegovina | ||
| Coordinates: 44°11′02″N 19°19′51″E / 44.18389°N 19.33083°ECoordinates: 44°11′02″N 19°19′51″E / 44.18389°N 19.33083°E | ||
| Country | Bosnia and Herzegovina | |
| Entity | Republika Srpska | |
| Government | ||
| • Mayor | Ivana Babić (SDS)[1] | |
| • Municipality | 293.49 km2 (113.32 sq mi) | |
| Population (2013 census) | ||
| • Town | 8,359 | |
| • Municipality | 20,340 | |
| • Municipality density | 69/km2 (180/sq mi) | |
| Time zone | UTC+1 (CET) | |
| • Summer (DST) | UTC+2 (CEST) | |
| Area code(s) | 56 | |
| Website |
www | |

Bratunac (Cyrillic: Братунац) is a town and municipality located in easternmost part of Republika Srpska, an entity of Bosnia and Herzegovina. As of 2013 census, it has a population of 20,340 inhabitants.
History
Early history
In 1381, the name Bratunac is mentioned for the first time because of the direct road through Bratunac from Bosnia and Herzegovina to Serbia. At the time, Bratunac was composed of five houses and a population of roughly 30 people. In 1927, Bratunac became a municipality for the first time.
Settlements
Aside from the town of Bratunac, the municipality consists of the following settlements:
- Abdulići
- Banjevići
- Biljača
- Bjelovac
- Blječeva
- Boljevići
- Brana Bačići
- Dubravice
- Fakovići
- Glogova
- Hranča
- Hrnčići
- Jagodnja
- Jaketići
- Jelah
- Ježeštica
- Joševa
- Konjevići
- Krasanovići
- Kravica
- Krke
- Lipenovići
- Loznica
- Magašići
- Mihaljevići
- Moštanice
- Mlečva
- Mratinci
- Oćenovići
- Opravdići
- Osamsko
- Pirići
- Pobrđe
- Pobuđe
- Podčauš
- Polom
- Rakovac
- Repovac
- Sikirić
- Slapašnica
- Stanatovići
- Suha
- Šiljkovići
- Svilile
- Tegare
- Urkovići
- Vitkovići
- Voljavica
- Vraneševići
- Zagoni
- Zalužje
- Zapolje
- Žlijebac
Demographics
| Historical population | ||
|---|---|---|
| Year | Pop. | ±% p.a. |
| 1961 | 23,149 | — |
| 1971 | 26,513 | +1.37% |
| 1981 | 30,333 | +1.36% |
| 1991 | 33,375 | +0.96% |
| 2013 | 20,340 | −2.23% |
According to Columbia-Lippincott Gazetteer, in 1948 Bratunac had a population of 5,033.
Ethnic groups
According to the 2013 census, the municipality of Bratunac has Serbs majority with 12,350 inhabitants (60.72%), followed by 7,803 Bosniaks (38.36%) and 33 Croats (0.16%). The ethnic composition of the municipality:
| Ethnic group | Population 1971 |
Population 1991 |
Population 2013[2] |
|---|---|---|---|
| Serbs | 12,820 | 11,479 | 12,350 |
| Bosniaks | 13,428 | 21,564 | 7,803 |
| Croats | 50 | 41 | 33 |
| Yugoslavs | 15 | 223 | - |
| Others | 200 | 291 | 154 |
| Total | 26,513 | 33,375 | 20,340 |
- Data by settlements
| Ethnic structure of population of Bratunac municipality, by settlements, 2013 census | |||||
|---|---|---|---|---|---|
| Settlement | total | Bosniaks | Croats | Serbs | others |
| Biljača | 306 | 301 | 0 | 5 | 0 |
| Bjelovac | 207 | 2 | 0 | 205 | 0 |
| Bratunac | 7,827 | 730 | 27 | 6,997 | 73 |
| Dubravice | 270 | 0 | 0 | 270 | 0 |
| Glogova | 920 | 914 | 0 | 6 | 0 |
| Hranča | 368 | 259 | 0 | 99 | 0 |
| Hrnčići | 780 | 0 | 0 | 0 | 0 |
| Ježeštica | 345 | 0 | 0 | 345 | 0 |
| Konjevići | 735 | 735 | 0 | 0 | 0 |
| Krasanovići | 287 | 156 | 0 | 130 | 1 |
| Kravica | 567 | 0 | 0 | 0 | 0 |
| Magašići | 527 | 236 | 2 | 289 | 0 |
| Mihaljevići | 233 | 231 | 0 | 2 | 0 |
| Opravdići | 275 | 23 | 0 | 252 | 0 |
| Pobuđe | 1,286 | 1,286 | 0 | 0 | 0 |
| Polom | 217 | 0 | 0 | 216 | 1 |
| Rakovac | 433 | 36 | 0 | 388 | 9 |
| Repovac | 352 | 13 | 3 | 336 | 0 |
| Slapašnica | 304 | 37 | 0 | 266 | 1 |
| Suha | 396 | 202 | 1 | 193 | 0 |
| Urkovići | 504 | 504 | 0 | 0 | 0 |
| Voljavica | 419 | 417 | 0 | 2 | 0 |
| Zagoni | 316 | 18 | 0 | 298 | 0 |
| Žlijebac | 272 | 0 | 0 | 272 | 0 |
See also
- Municipalities of Republika Srpska
- Konjević Polje
- Bratunac Massacre
- Veljaci Bratunac
References
- ↑ "Archived copy" (PDF). Archived from the original (PDF) on 2006-12-21. Retrieved 2006-12-21.
- ↑ "POPIS STANOVNIŠTVA, DOMAĆINSTAVA I STANOVA U BOSNI I HERCEGOVINI, 2013. REZULTATI POPISA" (PDF). popis2013.ba (in Serbian). Retrieved 15 December 2016.
External links
| Wikimedia Commons has media related to Bratunac. |
'