Binpur I
| Binpur I | |
|---|---|
| Community development block | |
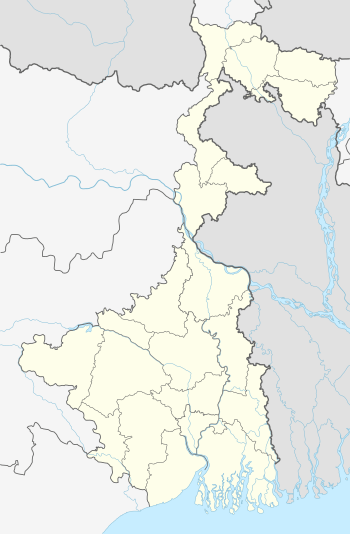 Binpur I Location in West Bengal, India 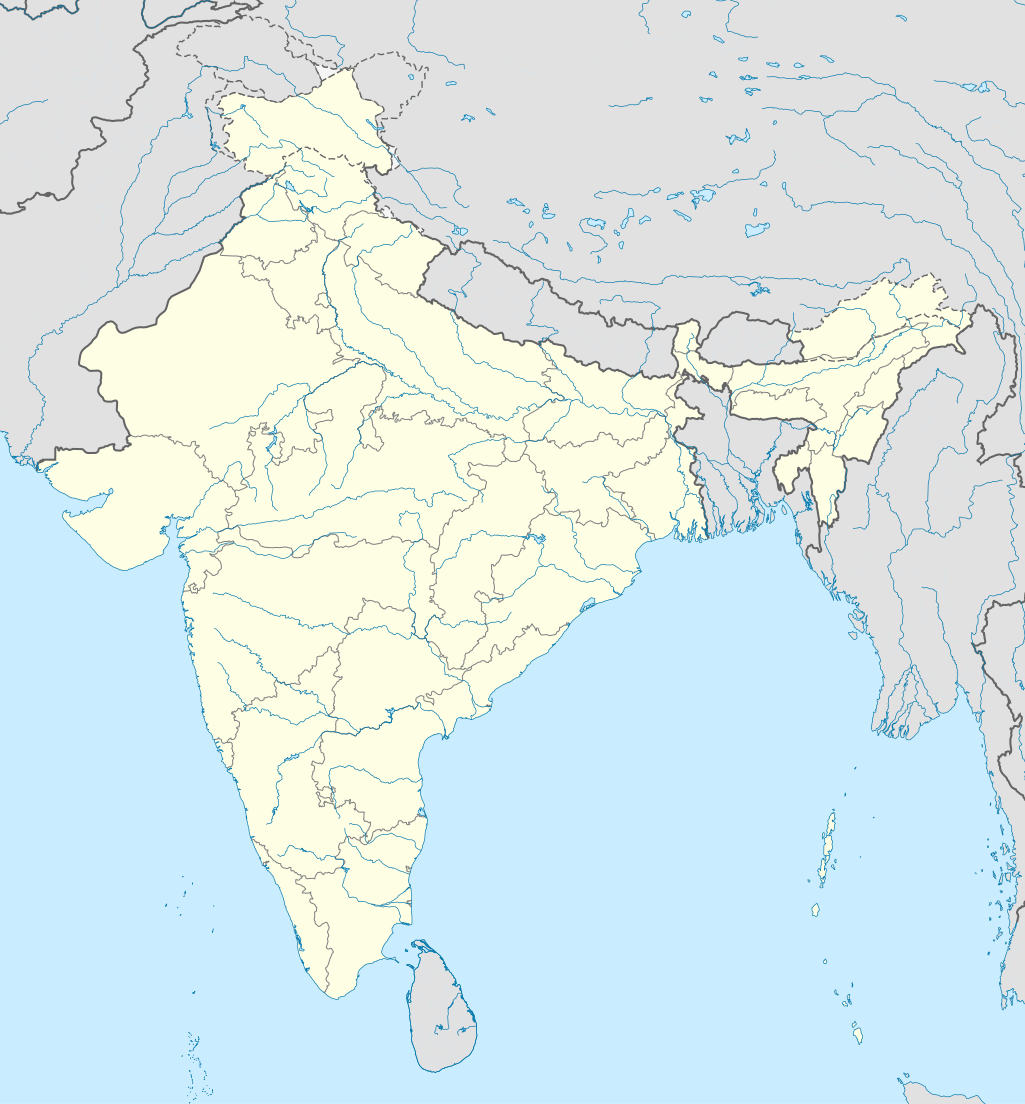 Binpur I Binpur I (India) | |
| Coordinates: 22°35′29″N 87°03′16″E / 22.59125°N 87.05431°ECoordinates: 22°35′29″N 87°03′16″E / 22.59125°N 87.05431°E | |
| Country |
|
| State | West Bengal |
| District | Jhargram |
| Government | |
| • Type | Community development block |
| Area | |
| • Total | 357.62 km2 (138.08 sq mi) |
| Elevation | 82 m (269 ft) |
| Population (2011) | |
| • Total | 156,153 |
| • Density | 440/km2 (1,100/sq mi) |
| Languages | |
| • Official | Bengali, English |
| Time zone | UTC+5:30 (IST) |
| PIN |
721502 (Binpur) 721504 (Dahijuri) 721516 (Lalgarh) 721141 (Ramgarh) |
| Area code(s) | 03221 |
| ISO 3166 code | IN-WB |
| Vehicle registration | WB-34 |
| Literacy | 69.74% |
| Lok Sabha constituency | Jhargram |
| Vidhan Sabha constituency | Jhargram |
| Website |
binpur1 |
Binpur I is a community development block that forms an administrative division in Jhargram subdivision of Jhargram district in the Indian state of West Bengal.
History
Lalgarh movement
The Lalgarh movement started attracting attention after the failed assassination attempt on Buddhadeb Bhattacharjee, then chief minister of West Bengal, in the Salboni area, on 2 November 2008 and the police action that followed. The movement was not just a political struggle but an armed struggle that concurrently took the look of a social struggle. A large nuber of CPI(M) activists, and others active in different political parties, were killed. Although the epi-centre of the movement was Lalgarh, it was spread across 19 police stations in three adjoining districts – Paschim Medinipur, Bankura and Purulia, all thickly forested and near the border with Jharkhand. The deployment of CRPF and other forces started on 11 June 2009. The movement came to an end after the 2011 state assembly elections and change of government in West Bengal. The death of Kishenji, the Maoist commander, on 24 November 2011 was the last major landmark.[1][2]
From 2009 Maoist violence had rapidly spread across eleven western CD Blocks of the district: Binpur I, Binpur II, Salboni, Grahbeta II, Jamboni, Jhargram, Midnapore Sadar, Gopiballavpur I, Gopiballavpur II, Sankrail and Nayagram.[3]
Netai massacre
Indiscriminate firing allegedly from a CPI (M) activist’s house killed 9 people in Netai village on 7 January 2011. As of 2016, the case is sub-judice.[4][5]
Red corridor
106 districts spanning 10 states across India, described as being part of Left Wing Extremism activities, constitute the Red corridor. In West Bengal the districts of Paschim Medinipur, Bankura, Purulia and Birbhum are part of the Red corridor. However, as of July 2016, there has been no reported incidents of Maoist related activities from these districts for the previous 4 years.[6] In the period 2009-2011 LWE violence resulted in more than 500 deaths and a similar number missing in Paschim Medinipur district.[7]
Geography
The Chota Nagpur Plateau gradually slopes down creating an undulating area with infertile laterite rocks/ soil. In Binpur I CD Block 70% of the cultivated area has lateritic soil and 30% has alluvial soil. Binpur I CD Block is drought prone with a particularly severe drought situation.[8]
Lalgarh is located at 22°35′29″N 87°03′16″E / 22.59125°N 87.05431°E.
Binpur I CD Block is bounded by Sarenga CD Block in Bankura district in the north, Garhbeta II, Salboni and Midnapore Sadar CD Blocks in the east, Jhargram and Jamboni CD Blocks in the south and Binpur II CD Block in the west.
It is located 39 km from Midnapore, the district headquarters.
Binpur I CD Block has an area of 357.62 km2. It has 1 panchayat samity, 10 gram panchayats, 115 gram sansads (village councils), 553 mouzas and 427 inhabited villages. Lalgarh police station serves this block.[9] Headquarters of this CD Block is at Lalgarh.[10]
Binpur I CD Block had a forest cover of 8,240 hectares, against a total geographical area of 36,243 hectares in 2005-06.[11]
Gram panchayats of Binpur I block/ panchayat samiti are: Andharia, Belatikri, Binpur, Boita, Dahijuri, Dharampur, Lalgarh, Nepuria, Ramgarh and Sijua.[12]
Demographics
Population
As per the 2011 Census of India Binpur I CD Block had a total population of 156,153, all of which were rural. There were 78,929 (51%) males and 77,224 (49%) females. Population below 6 years was 18,854. Scheduled Castes numbered 39,064 (25.02%) and Scheduled Tribes numbered 43,962 (28.15%).[13]
As per the 2001 census, Binpur I block had a total population of 139,136, out of which 71,072 were males and 68,064 were females. Binpur I block registered a population growth of 13.86 per cent during the 1991-2001 decade. Decadal growth for the combined Midnapore district was 14.87 per cent.[14] Decadal growth in West Bengal was 17.45 per cent.[15]
Large village (with 4,000+ population) in Binpur I CD Block is (2011 census figure in brackets): Lalgarh (4,433).[13]
Other villages in Binpur I CD Block are (2011 census figures in brackets): Binpur (1,842), Andharia (751), Sijua (2,263), Ramgarh (3,734), Netai (1,946), Baita (199), Bila Tikri (2,564), Dahijuri (3,237) and Dharampur (712).[13]
Literacy
As per the 2011 census the total number of literates in Binpur I CD Block was 95,753 (69.74% of the population over 6 years) out of which males numbered 55,228 (79.72% of the male population over 6 years) and females numbered 40,525 (59.58% of the female population over 6 years). The gender gap in literacy rates was 20.14%.[13]
See also – List of West Bengal districts ranked by literacy rate
| Literacy in CD Blocks of Paschim Medinipur district |
|---|
| Jhargram subdivision |
| Binpur I – 69.74% |
| Binpur II – 70.46% |
| Gopiballavpur I – 65.44% |
| Gopiballavpur II – 71.40% |
| Jamboni – 72.63% |
| Jhargram – 72.23% |
| Nayagram – 63.70% |
| Sankrail – 73.35% |
| Medinipur Sadar subdivision |
| Garhbeta I – 72.21% |
| Garhbeta II – 75.87% |
| Garhbeta III – 73.42% |
| Keshpur – 77.88% |
| Midnapore Sadar – 70.48% |
| Salboni – 74.87% |
| Ghatal subdivision |
| Chandrakona I – 78.93% |
| Chandrakona II – 75.96% |
| Daspur I – 83.99% |
| Daspur II – 85.62% |
| Ghatal – 81.08% |
| Kharagpur subdivision |
| Dantan I – 73.53% |
| Dantan II – 82.45% |
| Debra – 82.03% |
| Keshiari – 76.78% |
| Kharagpur I – 77.06% |
| Kharagpur II – 76.08% |
| Mohanpur – 80.51% |
| Narayangarh – 78.31% |
| Pingla – 83.57% |
| Sabang – 86.84% |
| Source: 2011 Census: CD Block Wise Primary Census Abstract Data |
Languages and religion
Bengali is the local language in these areas.
There is a tribal presence in many of the CD Blocks of the district. Santali is spoken by 55.93% of the tribal population of the district. The Bhumij, forming 11.16% of the tribal population, and the Mundas, forming 6.10% of the population, speak Mundari. Other small groups include Koras and Mahalis. The Lodhas, forming 3.85% of the tribal population, the only primitive tribe in the district, speak Lodhi.[16]
In the 2011 census Hindus numbered 120,976 and formed 77.47% of the population in Binpur I CD Block. Muslims numbered 6,073 and formed 3.89% of the population. Others numbered 29,104 and formed 18.64% of the population.[17] Others include Addi Bassi, Marang Boro, Santal, Saranath, Sari Dharma, Sarna, Alchchi, Bidin, Sant, Saevdharm, Seran, Saran, Sarin, Kheria,[17][18] Christians and other religious communities.[17]
BPL families
In Binpur I CD Block 47.46% families were living below poverty line in 2007.[19]
According to the District Human Development Report of Paschim Medinipur: The 29 CD Blocks of the district were classified into four categories based on the poverty ratio. Nayagram, Binpur II and Jamboni CD Blocks have very high poverty levels (above 60%). Kharagpur I, Kharagpur II, Sankrail, Garhbeta II, Pingla and Mohanpur CD Blocks have high levels of poverty (50-60%), Jhargram, Midnapore Sadar, Dantan I, Gopiballavpur II, Binpur I, Dantan II, Keshiari, Chandrakona I, Gopiballavpur I, Chandrakona II, Narayangarh, Keshpur, Ghatal, Sabang, Garhbeta I, Salboni, Debra and Garhbeta III CD Blocks have moderate levels of poverty (25-50%) and Daspur II and Daspur I have low levels of poverty (below 25%).[19]
Economy
Infrastructure
423 or 76% of mouzas in Binpur I CD Block were electrified by 31 March 2014.[20]
427 mouzas in Binpur I CD Block had drinking water facilities in 2013-14. There were 34 fertiliser depots, 24 seed stores and 52 fair price shops in the CD Block.[20]
Agriculture
Persons engaged in agriculture
in Binpur I CD Block
Although the Bargadari Act of 1950 recognised the rights of bargadars to a higher share of crops from the land that they tilled, it was not fully implemented. Large tracts, beyond the prescribed limit of land ceiling, remained with the rich landlords. From 1977 onwards major land reforms took place in West Bengal. Land in excess of land ceiling was acquired and distributed amongst the peasants.[21]Following land reforms land ownership pattern has undergone transformation. In 2013-14, persons engaged in agriculture in Binpur I CD Block could be classified as follows: bargadars 3.82%, patta (document) holders 23.62%, small farmers (possessing land between 1 and 2 hectares) 2.65%, marginal farmers (possessing land up to 1 hectare) 23.37% and agricultural labourers 46.54%.[20]
In 2005-06 net cropped area in Binpur I CD Block was 36,243 hectares and the area in which more than one crop was grown was 15,377 hectares.[22]
The extension of irrigation has played a role in growth of the predominantly agricultural economy.[23]In 2013-14, the total area irrigated in Binpur I CD Block was 8,340 hectares, out of which 500 by canal water, 350 hectares by tank water, 570 hectares by deep tube wells, 5,800 by shallow tube wells, 60 hectares by river lift irrigation, 260 hectares by open dug wells and 800 hectares by other methods.[20]
In 2013-14, Binpur I CD Block produced 132,024 tonnes of Aman paddy, the main winter crop, from 42,145 hectares, 154 tonnes of Aus paddy (summer crop)from 66 hectares, 2,484 tonnes of Boro paddy (spring crop) from 738 hectares, 1,151 tonnes of wheat from 400 hectares and 9,371 tonnes of potatoes from 571 hectares. It also produced maskalai, mustard and til. The production of Aman paddy was the highest amongst all the CD Blocks in the district.[20]
Banking
In 2013-14, Binpur I CD Block had offices of 10 commercial banks and 1 gramin bank.[20]
Transport
Binpur I CD Block has 6 ferry services and 15 originating/ terminating bus routes. The block headquarters are 42 km from nearest railway station.[20]
Education
In 2013-14, Binpur I CD Block had 137 primary schools with 9,247 students, 20 middle schools with 1,679 students and 16 higher secondary schools with 16,020 students. Binpur I CD Block had 510 institutions for special and non-formal education with 10,896 students. [20]
The United Nations Development Programme considers the combined primary and secondary enrolment ratio as the simple indicator of educational achievement of the children in the school going age. The infrastructure available is important. In Binpur I CD Block out of the total 137 primary schools in 2008-2009, 67 had pucca buildings, 15 partially pucca, 1 kacha and 54 multiple type.[24]
Lalgarh Government College was established in 2014 at Lalgarh. It is affiliated to Vidyasagar University. It offers honours courses in Bengali, Santali, English, Sanskrit, history, philosophy, political science and sociology, and general courses in BA and BSc (Bio Science).[25]
Healthcare
In 2014, Binpur I CD Block had 1 rural hospital and 5 primary health centres with total 96 beds and 9 doctors. It had 33 family welfare sub centres and 1 family welfare centre. 7,066 patients were treated indoor and 121,258 patients were treated outdoor in the hospitals, health centres and subcentres of the CD Block.[20]
External links

References
- ↑ "Lalgarh Battle". Frontline. 17 July 2009. Retrieved 23 July 2016.
- ↑ "Kishenji's death a serious blow to Maoist movement". The Hindu. 25 November 2011. Retrieved 23 July 2016.
- ↑ "District Human Development Report: Paschim Medinipur" (PDF). May 2011. Page 271. Development & Planning Department, Government of West Bengal. Retrieved 8 January 2017.
- ↑ "West Bengal's Netai massacre case: Accused CPM leader arrested". The Times of India, 9 May 2014. Retrieved 23 July 2016.
- ↑ "Netai massacre accused arrested". The Hindu, 9 May 2014. Retrieved 23 July 2016.
- ↑ Singh, Vijayita. "Red Corridor to be redrawn". The Hindu, 25 July 2016. Retrieved 1 August 2016.
- ↑ "District Human Development Report: Paschim Medinipur" (PDF). May 2011. Page 271. Development & Planning Department, Government of West Bengal. Retrieved 31 July 2016.
- ↑ "District Human Development Report: Paschim Medinipur" (PDF). page 4 (About Paschim Medinipur), page 26 (Predominant Soil), pages 265- 268 (Identification of Flood prone areas, Names of drought prone blocks). Development and Planning Department, Government of West Bengal, 2011. Retrieved 2 January 2017.
- ↑ "District Statistical Handbook 2014 Paschim Medinipur". Tables 2.1, 2.2. Department of Statistics and Programme Implementation, Government of West Bengal. Retrieved 10 October 2016.
- ↑ "District Census Handbook: Paschim Medinipur" (PDF). Map of Paschim Medinipur with CD Block HQs and Police Stations (on the fifth page). Directorate of Census Operations, West Bengal, 2011. Retrieved 20 November 2016.
- ↑ "District Human Development Report, Paschim Medinipur" (PDF). Table 2.4, Page 28. Development and Planning Department, Government of West Bengal, May 2011. Retrieved 2 January 2017.
- ↑ "Directory of District, Subdivision, Panchayat Samiti/ Block and Gram Panchayats in West Bengal". Paschim Medinipur - Revised in March 2008. Panchayats and Rural Development Department, Government of West Bengal. Retrieved 1 August 2016.
- 1 2 3 4 "C.D. Block Wise Primary Census Abstract Data(PCA)". 2011 census: West Bengal – District-wise CD Blocks. Registrar General and Census Commissioner, India. Retrieved 3 May 2016.
- ↑ "Provisional population totals, West Bengal, Table 4, (erstwhile) Medinipur District". Census of India 2001. Census Commission of India. Archived from the original on September 28, 2011. Retrieved 22 July 2016.
- ↑ "Provisional Population Totals, West Bengal. Table 4". Census of India 2001. Census Commission of India. Archived from the original on 27 September 2007. Retrieved 17 July 2016.
- ↑ "District Human Development Report: Paschim Medinipur" (PDF). Page 217 Scheduled Tribe Community. Development and Planning Department, Government of West Bengal, 2011. Retrieved 25 July 2016.
- 1 2 3 "C1 Population by Religious Community". West Bengal. Registrar General and Census Commissioner, India. Retrieved 29 July 2016.
- ↑ "ST-14 A Details Of Religions Shown Under 'Other Religions And Persuasions' In Main Table". West Bengal. Registrar General and Census Commissioner, India. Retrieved 29 July 2016.
- 1 2 "District Human Development Report: Paschim Medinipur" (PDF). May 2011. Page 177. Development & Planning Department, Government of West Bengal. Retrieved 8 January 2017.
- 1 2 3 4 5 6 7 8 9 "District Statistical Handbook 2014 Paschim Medinipur". Tables 2.1, 8.2, 16.1, 17.2, 18.2, 18.1, 20.1, 21.2, 4.4, 3.1, 3.3 – arranged as per use. Department of Statistics and Programme Implementation, Government of West Bengal. Retrieved 2 January 2017.
- ↑ "District Human Development Report: South 24 Parganas". (1) Chapter 1.2, South 24 Parganas in Historical Perspective, pages 7-9 (2) Chapter 3.4, Land reforms, pages 32-33. Development & Planning Department, Government of West Bengal, 2009. Retrieved 7 August 2016.
- ↑ "District Human Development Report, Paschim Medinipur" (PDF). Table 2.4, Page 28. Development and Planning Department, Government of West Bengal, May 2011. Retrieved 2 January 2017.
- ↑ "District Human Development Report: Paschim Medinipur" (PDF). Chapter V: Economic Livelihoods, pages 129-131. Development and Planning Department, Government of West Bengal, 2011. Retrieved 2 January 2017.
- ↑ "District Human Development Report: Paschim Medinipur" (PDF). May 2011. Page: 60. Development & Planning Department, Government of West Bengal. Retrieved 31 July 2016.
- ↑ "Lalgarh Government College". LGC. Retrieved 5 January 2017.
Jhargram district topics | |||
|---|---|---|---|
| General | |||
| People | |||
| Community development blocks |
| ||
| Rivers | |||
| Transport | |||
| Lok Sabha constituencies | |||
| Vidhan Sabha constituencies | |||
| See also |
| ||