Washington County, Virginia
Washington County is a county located in the Commonwealth of Virginia. As of the 2010 census, the population was 54,876.[2] Its county seat is Abingdon.[3]
Washington County | |
|---|---|
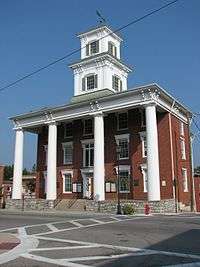 Washington County Courthouse | |
 Seal | |
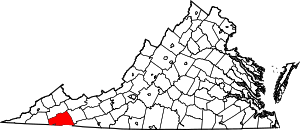 Location within the U.S. state of Virginia | |
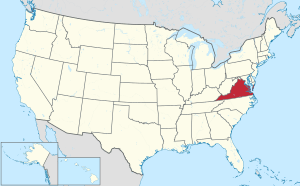 Virginia's location within the U.S. | |
| Coordinates: 36°43′N 81°58′W | |
| Country | |
| State | |
| Founded | 1776 |
| Named for | George Washington |
| Seat | Abingdon |
| Largest town | Abingdon |
| Area | |
| • Total | 566 sq mi (1,470 km2) |
| • Land | 561 sq mi (1,450 km2) |
| • Water | 5 sq mi (10 km2) 0.9% |
| Population (2010) | |
| • Total | 54,876 |
| • Estimate (2019)[1] | 53,740 |
| • Density | 97/sq mi (37/km2) |
| Time zone | UTC−5 (Eastern) |
| • Summer (DST) | UTC−4 (EDT) |
| Congressional district | 9th |
| Website | www |
Washington County is part of the Kingsport–Bristol–Bristol, TN-VA Metropolitan Statistical Area, which is a component of the Johnson City–Kingsport–Bristol, TN-VA Combined Statistical Area, commonly known as the "Tri-Cities" region.
History
For thousands of years, indigenous peoples of varying cultures lived in the area. At the time of European encounter, the Chiska had a chief village near what is now Saltville, destroyed by the Spaniards in 1568. The Cherokee annexed the region from the Xualae around 1671, and ceded it to the Virginia Colony in 1770 at the Treaty of Lochaber.
The county was formed by Virginians in 1776 from Fincastle County. It was named for George Washington, who was then commander-in-chief of the Continental Army. Washington County is among the first geographical regions to be named after the president of the United States.
Washington County was raided by the Chickamauga Cherokee during the Cherokee–American wars. In July, 1776, Chief Dragging Canoe led an attack on Black's Fort (renamed Abingdon in 1778). The area remained prone to attack until after Chickamauga leader Bob Benge was finally slain by settlers in Washington County in 1794.
As with many other frontier counties, the boundaries and territory changed over the years. In 1786 the northwestern part of Washington County became Russell County. In 1814 the western part of what remained of Washington County was combined with parts of Lee and Russell counties to form Scott County. In 1832 the northeastern part of Washington was combined with part of Wythe County to form Smyth County. Finally, with the incorporation of the town of Goodson as the independent city of Bristol in 1890, Washington County assumed its present size.

Geography
According to the U.S. Census Bureau, the county has a total area of 566 square miles (1,470 km2), of which 561 square miles (1,450 km2) is land and 5 square miles (13 km2) (0.9%) is water.[4]
Districts
The county is divided into seven magisterial districts: Harrison, Jefferson, Madison, Monroe, Taylor, Tyler, and Wilson.
Adjacent counties
- Smyth County, Virginia - northeast
- Grayson County, Virginia - east-southeast
- Johnson County, Tennessee - south-southeast
- Sullivan County, Tennessee - southwest
- Bristol(City), Virginia - southwest
- Scott County, Virginia - west
- Russell County, Virginia - northwest
National protected areas
- Jefferson National Forest (part)
- Mount Rogers National Recreation Area (part)
Demographics
| Historical population | |||
|---|---|---|---|
| Census | Pop. | %± | |
| 1790 | 5,625 | — | |
| 1800 | 9,536 | 69.5% | |
| 1810 | 12,156 | 27.5% | |
| 1820 | 12,444 | 2.4% | |
| 1830 | 15,614 | 25.5% | |
| 1840 | 13,001 | −16.7% | |
| 1850 | 14,612 | 12.4% | |
| 1860 | 16,892 | 15.6% | |
| 1870 | 16,816 | −0.4% | |
| 1880 | 25,203 | 49.9% | |
| 1890 | 29,020 | 15.1% | |
| 1900 | 28,995 | −0.1% | |
| 1910 | 32,830 | 13.2% | |
| 1920 | 32,376 | −1.4% | |
| 1930 | 33,850 | 4.6% | |
| 1940 | 38,197 | 12.8% | |
| 1950 | 37,536 | −1.7% | |
| 1960 | 38,076 | 1.4% | |
| 1970 | 40,835 | 7.2% | |
| 1980 | 46,487 | 13.8% | |
| 1990 | 45,887 | −1.3% | |
| 2000 | 51,103 | 11.4% | |
| 2010 | 54,876 | 7.4% | |
| Est. 2019 | 53,740 | [1] | −2.1% |
| U.S. Decennial Census[5] 1790-1960[6] 1900-1990[7] 1990-2000[8] 2010-2015[2] | |||
As of the census[9] of 2000, there were 51,103 people, 21,056 households, and 14,949 families residing in the county. The population density was 91 people per square mile (35/km²). There were 22,985 housing units at an average density of 41 per square mile (16/km²). The racial makeup of the county was 97.56% White, 1.32% Black or African American, 0.11% Native American, 0.27% Asian, 0.03% Pacific Islander, 0.14% from other races, and 0.58% from two or more races. 0.63% of the population were Hispanic or Latino of any race.
There were 21,056 households out of which 28.10% had children under the age of 18 living with them, 59.10% were married couples living together, 8.70% had a female householder with no husband present, and 29.00% were non-families. 25.80% of all households were made up of individuals and 10.40% had someone living alone who was 65 years of age or older. The average household size was 2.36 and the average family size was 2.84.
In the county, the population was spread out with 20.80% under the age of 18, 8.70% from 18 to 24, 28.30% from 25 to 44, 26.90% from 45 to 64, and 15.30% who were 65 years of age or older. The median age was 40 years. For every 100 females, there were 94.20 males. For every 100 females age 18 and over, there were 91.70 males.
The median income for a household in the county was $32,742, and the median income for a family was $40,162. Males had a median income of $30,104 versus $21,307 for females. The per capita income for the county was $18,350. About 8.10% of families and 10.90% of the population were below the poverty line, including 13.20% of those under age 18 and 14.20% of those age 65 or over.
Education
Colleges
- Emory and Henry College, Emory
- Virginia Highlands Community College, Abingdon
- Virginia Intermont College, Bristol (closed 2014) ** Portion ** The main VIC campus was located in the City of Bristol, however the Equestrian Center (now part of Emory & Henry College) is located in Washington County.
Public high schools
- Abingdon High School, Abingdon
- Holston High School, Damascus
- John S. Battle High School, Bristol
- Patrick Henry High School, Glade Spring
Communities
Towns

Census-designated places
Other unincorporated communities
- Azen
- Goose Pimple Junction
- Green Spring
- Konnarock
- Mendota
- Plasterco
- Taylor's Valley
Notable people
- Barbara Kingsolver, writer and novelist
- Joseph Meek, American frontiersman
Politics
| Year | Republican | Democratic | Third parties |
|---|---|---|---|
| 2016 | 74.8% 19,320 | 21.5% 5,553 | 3.8% 973 |
| 2012 | 70.8% 18,141 | 27.6% 7,076 | 1.6% 415 |
| 2008 | 65.6% 16,077 | 32.9% 8,063 | 1.5% 360 |
| 2004 | 65.5% 14,749 | 32.6% 7,339 | 1.9% 426 |
| 2000 | 59.7% 12,064 | 37.3% 7,549 | 3.0% 609 |
| 1996 | 50.1% 9,098 | 38.2% 6,939 | 11.7% 2,132 |
| 1992 | 48.2% 9,150 | 38.3% 7,269 | 13.6% 2,576 |
| 1988 | 63.5% 10,722 | 34.4% 5,819 | 2.1% 358 |
| 1984 | 68.1% 12,132 | 31.3% 5,573 | 0.7% 121 |
| 1980 | 53.9% 8,402 | 41.0% 6,390 | 5.2% 805 |
| 1976 | 49.0% 6,865 | 46.7% 6,547 | 4.3% 603 |
| 1972 | 72.7% 8,805 | 25.0% 3,028 | 2.3% 278 |
| 1968 | 51.2% 6,665 | 24.9% 3,243 | 24.0% 3,121 |
| 1964 | 44.9% 4,146 | 55.0% 5,070 | 0.1% 10 |
| 1960 | 53.6% 4,473 | 45.9% 3,833 | 0.5% 41 |
| 1956 | 56.4% 4,651 | 43.0% 3,547 | 0.6% 52 |
| 1952 | 57.7% 3,810 | 42.1% 2,778 | 0.2% 11 |
| 1948 | 52.2% 2,972 | 44.1% 2,510 | 3.7% 211 |
| 1944 | 49.3% 2,792 | 50.3% 2,849 | 0.4% 23 |
| 1940 | 45.1% 2,697 | 54.3% 3,245 | 0.6% 34 |
| 1936 | 44.0% 2,047 | 55.8% 2,595 | 0.3% 12 |
| 1932 | 38.3% 1,774 | 60.2% 2,784 | 1.5% 69 |
| 1928 | 56.4% 3,449 | 43.6% 2,666 | |
| 1924 | 47.3% 2,848 | 51.2% 3,083 | 1.5% 90 |
| 1920 | 54.1% 2,672 | 45.6% 2,251 | 0.2% 12 |
| 1916 | 47.8% 1,717 | 51.9% 1,863 | 0.3% 9 |
| 1912 | 17.8% 590 | 51.9% 1,721 | 30.3% 1,004 |
References
- "Population and Housing Unit Estimates". Retrieved April 1, 2020.
- "State & County QuickFacts". United States Census Bureau. Retrieved January 5, 2014.
- "Find a County". National Association of Counties. Retrieved 2011-06-07.
- "US Gazetteer files: 2010, 2000, and 1990". United States Census Bureau. 2011-02-12. Retrieved 2011-04-23.
- "U.S. Decennial Census". United States Census Bureau. Retrieved January 5, 2014.
- "Historical Census Browser". University of Virginia Library. Retrieved January 5, 2014.
- "Population of Counties by Decennial Census: 1900 to 1990". United States Census Bureau. Retrieved January 5, 2014.
- "Census 2000 PHC-T-4. Ranking Tables for Counties: 1990 and 2000" (PDF). United States Census Bureau. Retrieved January 5, 2014.
- "U.S. Census website". United States Census Bureau. Retrieved 2011-05-14.
- Leip, David. "Dave Leip's Atlas of U.S. Presidential Elections". uselectionatlas.org. Retrieved 2018-08-24.
External links
- Washington County government official website
- Washington County Virginia Public Schools
- Washington County Virginia Chamber of Commerce
- Washington County Virginia GIS (Geographic Information Systems)
- Mount Rogers Planning District
- Barter Theater (State Theater of Virginia)
Places adjacent to Washington County, Virginia | ||||||||||
|---|---|---|---|---|---|---|---|---|---|---|
| ||||||||||
Municipalities and communities of Washington County, Virginia, United States | ||
|---|---|---|
| Towns | Map of Virginia highlighting Washington County | |
| CDPs | ||
| Unincorporated communities |
| |
| Footnotes | ‡This populated place also has portions in an adjacent county or counties | |

| Authority control |
|
|---|