Fauquier County, Virginia
Fauquier /fɔːˈkɪər/ is a county in the Commonwealth of Virginia. As of the 2010 census, the population was 65,203.[1] The county seat is Warrenton.[2]
Fauquier County | |
|---|---|
County | |
| Fauquier County | |
 Fauquier County Courthouse in Warrenton | |
 Seal | |
 Location within the U.S. state of Virginia | |
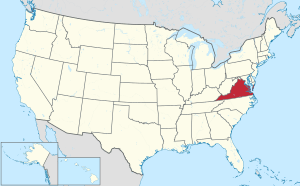 Virginia's location within the U.S. | |
| Coordinates: 38°44′N 77°49′W | |
| Country | |
| State | |
| Founded | 1759 |
| Named for | Francis Fauquier |
| Seat | Warrenton |
| Largest town | Warrenton |
| Area | |
| • Total | 651 sq mi (1,690 km2) |
| • Land | 647 sq mi (1,680 km2) |
| • Water | 3.8 sq mi (10 km2) 0.6% |
| Population (2010) | |
| • Total | 65,203 |
| • Estimate (2018) | 70,675 |
| • Density | 100/sq mi (39/km2) |
| Time zone | UTC−5 (Eastern) |
| • Summer (DST) | UTC−4 (EDT) |
| Congressional districts | 1st, 5th |
| Website | www |
Fauquier County is in Northern Virginia and is a part of the Washington metropolitan area. The county is one of the fastest-growing and highest-income counties in the United States.
History

In 1608, the first European to explore in the vicinity, Captain John Smith, reported that the Whonkentia (a subgroup of the Siouan-speaking Manahoac tribe) inhabited the area. The Manahoac were forced out around 1670 by the Iroquois (Seneca), who did not resettle the area.[3] The Conoy camped briefly near The Plains, from 1697 to 1699.[4] The Six Nations ceded the entire region including modern Fauquier to Virginia Colony at the Treaty of Albany, in 1722.
Fauquier County was established on May 1, 1759, from Prince William County. It is named for Francis Fauquier,[5] Lieutenant Governor of Virginia at the time, who won the land in a poker game, according to legend.
American Civil War battles in Fauquier County included (in order) the First Battle of Rappahannock Station, the Battle of Thoroughfare Gap, the Battle of Kelly's Ford, the Battle of Aldie, the Battle of Middleburg, the Battle of Upperville, the First and Second Battle of Auburn, the Battle of Buckland Mills, and the Second Battle of Rappahannock Station.
Geography
_in_Ashville%2C_Fauquier_County%2C_Virginia.jpg)

According to the U.S. Census Bureau, the county has an area of 651 square miles (1,690 km2), of which 647 square miles (1,680 km2) is land and 3.8 square miles (9.8 km2) (0.6%) is water.[6]
Adjacent counties
- Clarke County (north)
- Loudoun County (north)
- Prince William County (east)
- Stafford County (southeast)
- Culpeper County (southwest)
- Rappahannock County (west)
- Warren County (northwest)
Demographics
| Historical population | |||
|---|---|---|---|
| Census | Pop. | %± | |
| 1790 | 17,892 | — | |
| 1800 | 21,329 | 19.2% | |
| 1810 | 22,689 | 6.4% | |
| 1820 | 23,103 | 1.8% | |
| 1830 | 26,086 | 12.9% | |
| 1840 | 21,897 | −16.1% | |
| 1850 | 20,868 | −4.7% | |
| 1860 | 21,706 | 4.0% | |
| 1870 | 19,690 | −9.3% | |
| 1880 | 22,993 | 16.8% | |
| 1890 | 22,590 | −1.8% | |
| 1900 | 23,374 | 3.5% | |
| 1910 | 22,526 | −3.6% | |
| 1920 | 21,869 | −2.9% | |
| 1930 | 21,071 | −3.6% | |
| 1940 | 21,039 | −0.2% | |
| 1950 | 21,248 | 1.0% | |
| 1960 | 24,066 | 13.3% | |
| 1970 | 26,375 | 9.6% | |
| 1980 | 35,889 | 36.1% | |
| 1990 | 48,741 | 35.8% | |
| 2000 | 55,139 | 13.1% | |
| 2010 | 65,203 | 18.3% | |
| Est. 2018 | 70,675 | [7] | 8.4% |
| U.S. Decennial Census[8] 1790-1960[9] 1900-1990[10] 1990-2000[11] | |||
As of the census of 2013, there were 67,207 people, and 23,130 households in the county. The population density was 100.7 people per square mile (41/km2). There were 25,930 housing units at an average density of 45 per square mile (13/km2). The racial makeup of the county was 87.4% White, 8.2% Black or African American, 0.5% Native American, 1.5% Asian, 0.01% Pacific Islander, 0.09% from other races, and 2.3% from two or more races. 6.9% of the population were Hispanic or Latino of any race.
In 2000 there were 19,842 households out of which 36.10% had children under the age of 18 living with them, 63.80% were married couples living together, 8.60% had a female householder with no husband present, and 23.70% were non-families. 18.70% of all households were made up of individuals and 6.20% had someone living alone who was 65 years of age or older. The average household size was 2.75 and the average family size was 3.14.
As of 2013, the population was spread out with 24.2% under the age of 18, 6.40% from 18 to 24, 30.30% from 25 to 44, 26.00% from 45 to 64, and 14.4% who were 65 years of age or older. The median age was 38 years. For every 100 females, there were 98.8 males. For every 100 females age 18 and over, there were 95.4 males.
The median income for a household in the county was $93,762.[12] The per capita income for the county was $39,600. About 3.70% of families and 5.60% of the population were below the poverty line, including 4.70% of those under age 18 and 8.70% of those age 65 or over.
The county is exurban. There has been increased growth in Warrenton and New Baltimore in recent years. The subdivisions of Brookside and Vint Hill have facilitated the growth in the eastern part of the county. There is some industry in Fauquier County, however the largest employer in the County is the county government and the hospital. As of the 2000 census, 47% of county residents that work have jobs that are outside the county.[13] The average travel time to work is 39.2 minutes.
Government
Board of Supervisors
- Cedar Run District: Richard Gerhardt (R) - Vice Chairman
- Center District: Chris N. Granger (R) - Chairman
- Lee District: Christopher Butler (R)
- Marshall District: Mary Leigh McDaniel (I)
- Scott District: R. Holder Trumbo Jr. (R) [14]
Constitutional officers
Legislators
The Virginia Senate:
- Jill Holtzman Vogel (R)
The Virginia House of Delegates:
- Michael J. Webert (R)
- Elizabeth R. Guzmán (D)
- Mark L. Cole (R)
The U.S. House of Representatives:
| Year | Republican | Democratic | Third parties |
|---|---|---|---|
| 2016 | 59.1% 22,127 | 34.6% 12,971 | 6.3% 2,362 |
| 2012 | 59.2% 21,034 | 39.3% 13,965 | 1.6% 556 |
| 2008 | 56.2% 19,227 | 42.7% 14,616 | 1.1% 376 |
| 2004 | 63.6% 19,011 | 35.8% 10,712 | 0.6% 192 |
| 2000 | 61.6% 14,456 | 35.3% 8,296 | 3.1% 729 |
| 1996 | 57.5% 11,063 | 35.1% 6,759 | 7.5% 1,436 |
| 1992 | 50.6% 10,497 | 31.8% 6,600 | 17.6% 3,662 |
| 1988 | 69.9% 11,733 | 28.8% 4,837 | 1.4% 226 |
| 1984 | 71.4% 10,319 | 28.1% 4,056 | 0.5% 76 |
| 1980 | 58.1% 6,782 | 35.3% 4,119 | 6.6% 769 |
| 1976 | 51.8% 4,715 | 43.9% 4,002 | 4.3% 394 |
| 1972 | 67.7% 4,654 | 29.7% 2,039 | 2.6% 180 |
| 1968 | 43.8% 2,845 | 32.3% 2,099 | 24.0% 1,557 |
| 1964 | 37.4% 2,101 | 62.5% 3,506 | 0.1% 6 |
| 1960 | 51.9% 2,123 | 47.8% 1,958 | 0.3% 13 |
| 1956 | 55.6% 2,112 | 41.2% 1,567 | 3.2% 123 |
| 1952 | 56.3% 2,068 | 43.5% 1,597 | 0.3% 10 |
| 1948 | 41.3% 1,102 | 48.4% 1,291 | 10.3% 274 |
| 1944 | 34.0% 1,089 | 65.9% 2,110 | 0.2% 5 |
| 1940 | 28.7% 756 | 71.1% 1,874 | 0.3% 7 |
| 1936 | 23.5% 629 | 76.2% 2,037 | 0.2% 6 |
| 1932 | 15.8% 379 | 83.4% 1,999 | 0.8% 18 |
| 1928 | 38.8% 972 | 61.2% 1,531 | |
| 1924 | 20.1% 345 | 74.6% 1,277 | 5.3% 91 |
| 1920 | 29.3% 568 | 70.3% 1,365 | 0.4% 8 |
| 1916 | 23.3% 367 | 76.5% 1,204 | 0.2% 3 |
| 1912 | 12.5% 182 | 81.3% 1,187 | 6.3% 92 |
Education
Elementary schools
- C. M. Bradley Elementary School
- James G. Brumfield Elementary School
- W. G. Coleman Elementary School
- Grace Miller Elementary School
- H. M. Pearson Elementary School
- C. Hunter Ritchie Elementary School
- P. B. Smith Elementary School
- Claude Thompson Elementary School
- Mary Walter Elementary School
- Greenville Elementary School
- M. M. Pierce Elementary School
Middle schools
- Auburn Middle School
- Cedar Lee Middle School
- W. C. Taylor Middle School
- Marshall Middle School
- Warrenton Middle School
High schools
Private schools
Higher education
- Lord Fairfax Community College
- Thorpe House Adult Learning Center
Notable people
- Turner Ashby, born in Fauquier County, Confederate Army colonel in the American Civil War.[17]
- Martin Berkofsky, classical pianist and philanthropist.
- Irv Cross, American footballer and sportscaster.
- Susan Cummings, an heiress infamous for killing Argentine polo player Roberto Villegas.
- Robert Duvall, American-born actor who maintains a farm in The Plains.
- Bertram and Diana Firestone, owners of Newstead Farm.
- George B. Fitch, American businessman, Mayor of Warrenton, founder of Jamaican Bobsled Team.
- Rear Admiral Cary Travers Grayson, owner of historic Blue Ridge Farm.
- Eppa Hunton, U.S. Representative and Senator from Virginia, born and lived in Warrenton.
- Charles Marshall, born in Warrenton, assistant adjutant general, aide de camp and military secretary to Gen. Robert E. Lee. Grandnephew of Chief Justice John Marshall.
- James K. Marshall, Colonel in the Confederate States Army, killed in action during Pickett's Charge at the Battle of Gettysburg while leading the brigade of J. Johnston Pettigrew, grandson of Chief Justice John Marshall.
- John Marshall, born in Fauquier County, Chief Justice of the United States.
- Paul Mellon, philanthropist, an Exemplar of Racing and owner of Rokeby Farm.
- John S. Mosby, lived in Warrenton, was a Confederate partisan ranger and cavalryman during the American Civil War. Buried in Warrenton cemetery.
- Albert Rust, 19th-century American politician who served as a senior officer of the Confederate States Army during the American Civil War (1861-1865).
- Michaele Salahi and Tareq Salahi, the White House Gate Crashers.
- Willard Scott, an American media personality best known for his work on NBC's The Today Show who lives in Paris, Virginia.
- Scott Shipp, born in Warrenton, Superintendent of Virginia Military Institute from 1890–1907.
- Isabel Dodge Sloane, owner of Brookmeade Stud.
- William "Extra Billy" Smith, died in Warrenton, was a lawyer, congressman, two time Governor of Virginia and one of the oldest Confederate generals in the American Civil War.
- Liz Whitney Tippett, owner of the Llangollen estate.
- Karen O'Connor and David O'Connor, Olympic eventing riders
See also
References
- "State & County QuickFacts". United States Census Bureau. Retrieved January 2, 2014.
- "Find a County". National Association of Counties. Archived from the original on 2011-05-31. Retrieved 2011-06-07.
- Swanton, John R. (1952), The Indian Tribes of North America, Smithsonian Institution, pp. 61–62, ISBN 0-8063-1730-2, OCLC 52230544
- Harrison Williams, Legends of Loudoun, pp. 20-21.
- Gannett, Henry (1905). The Origin of Certain Place Names in the United States. Govt. Print. Off. pp. 124.
- "US Gazetteer files: 2010, 2000, and 1990". United States Census Bureau. 2011-02-12. Retrieved 2011-04-23.
- "Population and Housing Unit Estimates". Retrieved July 14, 2019.
- "U.S. Decennial Census". United States Census Bureau. Retrieved January 2, 2014.
- "Historical Census Browser". University of Virginia Library. Archived from the original on August 11, 2012. Retrieved January 2, 2014.
- "Population of Counties by Decennial Census: 1900 to 1990". United States Census Bureau. Archived from the original on December 15, 2013. Retrieved January 2, 2014.
- "Census 2000 PHC-T-4. Ranking Tables for Counties: 1990 and 2000" (PDF). United States Census Bureau. Archived (PDF) from the original on December 18, 2014. Retrieved January 2, 2014.
- Bureau, U.S. Census. "American FactFinder - Community Facts". factfinder.census.gov. Archived from the original on 11 February 2020. Retrieved 7 May 2018.
- "Fauquier Times-Democrat: Get A Life, Lose The Commute, August 30, 2007". Archived from the original on 2013-01-22.
- "Meet the Board Members". Fauquier County. Archived from the original on 2017-12-30. Retrieved 2017-12-30.
- "Constitutional Officers". Fauquier County. Archived from the original on 2017-12-30. Retrieved 2017-12-30.
- Leip, David. "Dave Leip's Atlas of U.S. Presidential Elections". uselectionatlas.org. Archived from the original on 23 March 2018. Retrieved 7 May 2018.
- Who Was Who in America, Historical Volume, 1607-1896. Chicago: Marquis Who's Who. 1963.
External links
| Wikimedia Commons has media related to Fauquier County, Virginia. |
Places adjacent to Fauquier County, Virginia | |
|---|---|
Municipalities and communities of Fauquier County, Virginia, United States | ||
|---|---|---|
| Towns | Map of Virginia highlighting Fauquier County | |
| CDPs | ||
| Unincorporated communities | ||
| Footnotes | ‡This populated place also has portions in an adjacent county or counties | |

| Principal cities (and city-like entities) |
|   | |||||||
|---|---|---|---|---|---|---|---|---|---|
| Counties (and county equivalents) |
| ||||||||
The District of Columbia itself, and Virginia's incorporated cities, are county equivalents. Virginia's incorporated cities are listed under their surrounding county. The incorporated cities bordering more than one county (Alexandria, Falls Church and Fredericksburg) are listed under the county they were part of before incorporation as a city. Some unincorporated areas and census-designated places like Silver Spring and Bethesda in Maryland, Reston in Virginia, as well as the County of Arlington in Virginia are also treated as city-like entities (or principal cities) even though they have not been legally incorporated as such. | |||||||||
| Authority control |
|
|---|