Pulaski County, Virginia
Pulaski County is a county located in the U.S. state of Virginia. As of the 2010 census, the population was 34,872.[2] Its county seat is Pulaski.[3]
Pulaski County | |
|---|---|
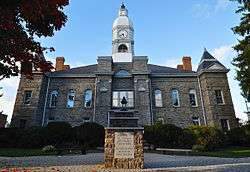 Pulaski County Courthouse | |
 Seal | |
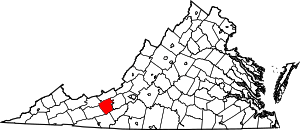 Location within the U.S. state of Virginia | |
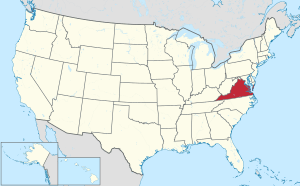 Virginia's location within the U.S. | |
| Coordinates: 37°04′N 80°43′W | |
| Country | |
| State | |
| Founded | 1839 |
| Named for | Casimir Pulaski |
| Seat | Pulaski |
| Largest town | Pulaski |
| Area | |
| • Total | 330 sq mi (900 km2) |
| • Land | 320 sq mi (800 km2) |
| • Water | 10 sq mi (30 km2) 3.0% |
| Population (2010) | |
| • Total | 34,872 |
| • Estimate (2018)[1] | 34,066 |
| • Density | 110/sq mi (41/km2) |
| Time zone | UTC−5 (Eastern) |
| • Summer (DST) | UTC−4 (EDT) |
| Congressional district | 9th |
| Website | www |
Pulaski County is part of the Blacksburg–Christiansburg, VA Metropolitan Statistical Area.
History
Pulaski County was formed on March 30, 1839, from parts of Montgomery and Wythe counties, becoming the 87th county of the Commonwealth of Virginia. It was named for Count Casimir Pulaski, an exiled Polish nobleman who fought during the American Revolution as part of George Washington's army. He joined the army in 1777 and became a brigadier general and chief of cavalry in the Continental Army. He was fatally wounded at Savannah and died on October 11, 1779.[4]
This area of the Blue Ridge has rolling hills and was settled by mostly small farmers, recent Scots-Irish and German immigrants and their descendants who migrated down the Shenandoah Valley from Pennsylvania in the mid to late-18th century. They pushed out or killed most Native Americans in the area. The new settlers were yeomen, who held fewer slaves than in the Tidewater area. Nonetheless, by 1840 about one-quarter of the population was made up of enslaved African Americans. The county had 3,739 persons, consisting of 2,768 free whites, and 971 blacks. Some 17 of the latter were free blacks.
Geography
According to the U.S. Census Bureau, the county has a total area of 330 square miles (850 km2), of which 320 square miles (830 km2) is land and 10 square miles (26 km2) (3.0%) is water.
Pulaski County is the site of Claytor Lake State Park, which is located on Claytor Lake, a 4,500-acre (18 km2), 21-mile (34 km) long man-made lake on the New River created for a hydroelectric project of Appalachian Power Company. It is named for W. Graham Claytor, Sr. (1886–1971) of Roanoke, Virginia, a vice president of Appalachian Power who supervised construction of the dam and creation of the lake.
Adjacent counties / Independent city
- Bland County, Virginia – northwest
- Giles County, Virginia – north
- Montgomery County, Virginia – northeast
- Radford, Virginia – northeast
- Floyd County, Virginia – southeast
- Carroll County, Virginia – south
- Wythe County, Virginia – southwest
National protected area
- Jefferson National Forest (part)
Demographics
| Historical population | |||
|---|---|---|---|
| Census | Pop. | %± | |
| 1840 | 3,739 | — | |
| 1850 | 5,118 | 36.9% | |
| 1860 | 5,416 | 5.8% | |
| 1870 | 6,538 | 20.7% | |
| 1880 | 8,755 | 33.9% | |
| 1890 | 12,790 | 46.1% | |
| 1900 | 14,609 | 14.2% | |
| 1910 | 17,246 | 18.1% | |
| 1920 | 17,111 | −0.8% | |
| 1930 | 20,566 | 20.2% | |
| 1940 | 22,767 | 10.7% | |
| 1950 | 27,758 | 21.9% | |
| 1960 | 27,258 | −1.8% | |
| 1970 | 29,564 | 8.5% | |
| 1980 | 35,229 | 19.2% | |
| 1990 | 34,496 | −2.1% | |
| 2000 | 35,127 | 1.8% | |
| 2010 | 34,872 | −0.7% | |
| Est. 2018 | 34,066 | [1] | −2.3% |
| U.S. Decennial Census[5] 1790–1960[6] 1900–1990[7] 1990–2000[8] 2010–2013[2] | |||
As of the census[9] of 2000, there were 35,127 people, 14,643 households, and 10,147 families residing in the county. The population density was 110 people per square mile (42/km²). There were 16,325 housing units at an average density of 51 per square mile (20/km²). The racial makeup of the county was 92.60% White, 5.57% Black or African American, 0.15% Native American, 0.32% Asian, 0.04% Pacific Islander, 0.37% from other races, and 0.94% from two or more races. 0.96% of the population were Hispanic or Latino of any race.
There were 14,643 households out of which 26.90% had children under the age of 18 living with them, 54.90% were married couples living together, 10.50% had a female householder with no husband present, and 30.70% were non-families. 27.00% of all households were made up of individuals and 11.10% had someone living alone who was 65 years of age or older. The average household size was 2.32 and the average family size was 2.80.
In the county, the population was spread out with 20.60% under the age of 18, 7.30% from 18 to 24, 29.20% from 25 to 44, 27.70% from 45 to 64, and 15.20% who were 65 years of age or older. The median age was 40 years. For every 100 females, there were 97.40 males. For every 100 females age 18 and over, there were 95.20 males.
The median income for a household in the county was $33,873, and the median income for a family was $42,251. Males had a median income of $30,712 versus $21,596 for females. The per capita income for the county was $18,973. About 10.60% of families and 13.10% of the population were below the poverty line, including 18.90% of those under age 18 and 11.50% of those age 65 or over.
Schools
Secondary and Higher Education
- New River Community College
- Southwest Virginia Governor School
- Pulaski County High School
Middle schools
- Pulaski Middle School
- Dublin Middle School
Elementary schools
- Pulaski Elementary School
- Dublin Elementary School
- Critzer Elementary School
- Riverlawn Elementary School
- Snowville Elementary School
Communities
Other unincorporated communities
- Caseknife
- Claytor Lake
- Newbern
- Wurno
- Little Creek
- Delton
- Tinytown
Politics
| Year | Republican | Democratic | Third parties |
|---|---|---|---|
| 2016 | 68.1% 10,322 | 27.5% 4,172 | 4.4% 671 |
| 2012 | 60.8% 8,920 | 36.1% 5,292 | 3.2% 468 |
| 2008 | 58.9% 8,857 | 39.3% 5,918 | 1.8% 275 |
| 2004 | 61.5% 8,769 | 37.3% 5,310 | 1.2% 172 |
| 2000 | 55.8% 7,089 | 41.4% 5,255 | 2.8% 353 |
| 1996 | 43.8% 5,387 | 43.3% 5,333 | 12.9% 1,584 |
| 1992 | 44.0% 6,148 | 40.3% 5,633 | 15.8% 2,206 |
| 1988 | 58.4% 6,844 | 40.0% 4,686 | 1.6% 189 |
| 1984 | 64.9% 8,242 | 34.4% 4,364 | 0.7% 93 |
| 1980 | 47.7% 5,747 | 47.9% 5,769 | 4.4% 524 |
| 1976 | 44.8% 4,764 | 52.2% 5,546 | 3.0% 314 |
| 1972 | 72.0% 6,281 | 26.5% 2,311 | 1.5% 130 |
| 1968 | 53.4% 4,409 | 30.2% 2,497 | 16.5% 1,359 |
| 1964 | 46.1% 3,101 | 53.8% 3,620 | 0.1% 5 |
| 1960 | 58.8% 3,059 | 40.4% 2,104 | 0.9% 44 |
| 1956 | 63.1% 3,517 | 35.8% 1,994 | 1.2% 67 |
| 1952 | 62.0% 2,815 | 37.8% 1,715 | 0.2% 8 |
| 1948 | 49.0% 1,691 | 40.9% 1,412 | 10.1% 349 |
| 1944 | 37.7% 1,302 | 62.3% 2,155 | 0.0% 1 |
| 1940 | 31.4% 1,023 | 68.4% 2,226 | 0.2% 6 |
| 1936 | 33.5% 1,180 | 66.4% 2,337 | 0.1% 4 |
| 1932 | 32.1% 1,109 | 67.0% 2,314 | 0.9% 31 |
| 1928 | 52.3% 1,998 | 47.7% 1,821 | |
| 1924 | 43.3% 1,422 | 53.8% 1,767 | 2.8% 93 |
| 1920 | 48.4% 1,710 | 51.4% 1,814 | 0.2% 7 |
| 1916 | 38.7% 721 | 56.7% 1,057 | 4.6% 86 |
| 1912 | 13.3% 196 | 52.9% 781 | 33.9% 500 |
Pulaski County reps in state government
References
- "Population and Housing Unit Estimates". Retrieved July 14, 2019.
- "State & County QuickFacts". United States Census Bureau. Archived from the original on March 1, 2016. Retrieved January 4, 2014.
- "Find a County". National Association of Counties. Retrieved 2011-06-07.
- History of Pulaski County (PDF)
- "U.S. Decennial Census". United States Census Bureau. Retrieved January 4, 2014.
- "Historical Census Browser". University of Virginia Library. Retrieved January 4, 2014.
- "Population of Counties by Decennial Census: 1900 to 1990". United States Census Bureau. Retrieved January 4, 2014.
- "Census 2000 PHC-T-4. Ranking Tables for Counties: 1990 and 2000" (PDF). United States Census Bureau. Retrieved January 4, 2014.
- "U.S. Census website". United States Census Bureau. Retrieved 2011-05-14.
- Leip, David. "Dave Leip's Atlas of U.S. Presidential Elections". uselectionatlas.org. Retrieved 2018-08-22.
- Rogers, George Wesley (1959). Officers of the Senate of Virginia 1776–1956. Library of Congress Catalog Card Number 59-12727: Garrett & Massie, Inc. p. 57.CS1 maint: location (link)
- Rogers, George Wesley (1959). Officers of the Senate of Virginia. Library of Congress Catalog Number 59-12727: Garrett & Massie, Inc. p. 61.CS1 maint: location (link)
- "Governor Tyler Hotel".
External links
- Claytor Lake Online Website
- Pulaski County, Virginia official website
- Claytor Lake State Park (Virginia)
- Virginia Dept. of Game and Inland Fisheries, Claytor Lake webpage
Places adjacent to Pulaski County, Virginia | ||||||||||
|---|---|---|---|---|---|---|---|---|---|---|
| ||||||||||
Municipalities and communities of Pulaski County, Virginia, United States | ||
|---|---|---|
| Towns | Map of Virginia highlighting Pulaski County | |
| CDPs | ||
| Unincorporated communities | ||

| Authority control |
|
|---|