Southampton County, Virginia
Southampton County is a county located on the southern border of the Commonwealth of Virginia. North Carolina is to the south. As of the 2010 census, the population was 18,570.[2] Its county seat is Courtland.[3]
Southampton County | |
|---|---|
 Southampton County Courthouse | |
 Seal | |
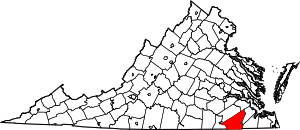 Location within the U.S. state of Virginia | |
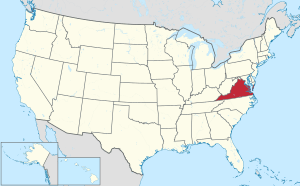 Virginia's location within the U.S. | |
| Coordinates: 36°46′15″N 77°09′38″W | |
| Country | |
| State | |
| Founded | 1749 |
| Named for | either Southampton, England, or Henry Wriothesley, 3rd Earl of Southampton |
| Seat | Courtland |
| Largest town | Courtland |
| Area | |
| • Total | 602 sq mi (1,560 km2) |
| • Land | 599 sq mi (1,550 km2) |
| • Water | 3.2 sq mi (8 km2) 0.5% |
| Population (2010) | |
| • Total | 18,570 |
| • Estimate (2018)[1] | 17,586 |
| • Density | 31/sq mi (12/km2) |
| Time zone | UTC−5 (Eastern) |
| • Summer (DST) | UTC−4 (EDT) |
| Congressional district | 4th |
| Website | www |
History
During the 17th century, shortly after establishment of Jamestown, Virginia in 1607, English settlers explored and began settling the areas adjacent to Hampton Roads. In 1634, the English colony of Virginia was divided into eight shires (or counties) with a total population of approximately 5,000 inhabitants. Most of Southampton County was originally part of Warrosquyoake Shire. The shires were soon to be called counties. In 1637 Warrosquyoake Shire was renamed Isle of Wight County.[4]
In 1749, the portion of Isle of Wight County west of the Blackwater River was organized as Southampton County. Later, part of Nansemond County, which is now the Independent City of Suffolk, was added to Southampton County. This area was cultivated for tobacco and later for mixed crops, dependent on the labor of African slaves after a relatively short period when many white indentured servants came to the colony.
In August 1831, a slave preacher named Nat Turner led a slave rebellion in Southampton County against local white residents, killing about 60 people (mainly women and children). The rebellion was crushed, and Turner and his rebels were tried, convicted, and executed. Meanwhile, white mobs had seized and lynched nearly 200 black residents of Southampton County, most of them slaves.[5]
Southampton County may have been named for Southampton, a major city in England. IN the alternative, it may have been named for Henry Wriothesley, 3rd Earl of Southampton, one of the founders of the Virginia Company and a supporter of colonization in North America.
Geography
According to the U.S. Census Bureau, the county has a total area of 602 square miles (1,560 km2), of which 599 square miles (1,550 km2) is land and 3.2 square miles (8.3 km2) (0.5%) is water.[6]
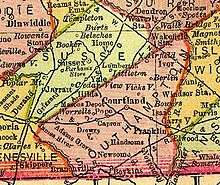
Southampton County is bounded by the Blackwater River on the east and the Meherrin River on the west. The Nottoway River flows through the center of the county. All three rivers are tributaries of the Chowan River, which flows south into Albemarle Sound, North Carolina. The Blackwater River separates Southampton County from Isle of Wight County, and the Meherrin River separates it from Greensville County.
Adjacent counties
|
|
Demographics
| Historical population | |||
|---|---|---|---|
| Census | Pop. | %± | |
| 1790 | 12,864 | — | |
| 1800 | 13,925 | 8.2% | |
| 1810 | 13,497 | −3.1% | |
| 1820 | 14,170 | 5.0% | |
| 1830 | 16,074 | 13.4% | |
| 1840 | 14,525 | −9.6% | |
| 1850 | 13,521 | −6.9% | |
| 1860 | 12,915 | −4.5% | |
| 1870 | 12,285 | −4.9% | |
| 1880 | 18,012 | 46.6% | |
| 1890 | 20,078 | 11.5% | |
| 1900 | 22,848 | 13.8% | |
| 1910 | 26,302 | 15.1% | |
| 1920 | 27,555 | 4.8% | |
| 1930 | 26,870 | −2.5% | |
| 1940 | 26,442 | −1.6% | |
| 1950 | 26,522 | 0.3% | |
| 1960 | 27,195 | 2.5% | |
| 1970 | 18,582 | −31.7% | |
| 1980 | 18,731 | 0.8% | |
| 1990 | 17,550 | −6.3% | |
| 2000 | 17,482 | −0.4% | |
| 2010 | 18,570 | 6.2% | |
| Est. 2018 | 17,586 | [1] | −5.3% |
| U.S. Decennial Census[7] 1790–1960[8] 1900–1990[9] 1990–2000[10] 2010–2013[2] | |||
As of the census[11] of 2010, there were 18,570 people, 6,279 households, and 4,502 families residing in the county. The population density was 29 people per square mile (11/km²). There were 7,058 housing units at an average density of 12 per square mile (5/km²). The racial makeup of the county was 60.4% White, 37.2% Black or African American, 0.3% Native American, 0.2% Asian, 0.0% Pacific Islander, 0.3% from other races, and 1.4% from two or more races. 1.1% of the population were Hispanic or Latino of any race.
There were 6,279 households out of which 30.80% had children under the age of 18 living with them, 54.10% were married couples living together, 13.50% had a female householder with no husband present, and 28.30% were non-families. 24.90% of all households were made up of individuals and 11.10% had someone living alone who was 65 years of age or older. The average household size was 2.53 and the average family size was 3.02.
In the county, the population was spread out with 22.70% under the age of 18, 8.80% from 18 to 24, 29.20% from 25 to 44, 25.00% from 45 to 64, and 14.20% who were 65 years of age or older. The median age was 39 years. For every 100 females there were 111.70 males. For every 100 females age 18 and over, there were 112.50 males.
The median income for a household in the county was $33,995, and the median income for a family was $41,324. Males had a median income of $32,436 versus $20,831 for females. The per capita income for the county was $16,930. About 11.70% of families and 14.60% of the population were below the poverty line, including 19.90% of those under age 18 and 14.50% of those age 65 or over.
Public services
Blackwater Regional Library is the regional library system that provides services to the citizens of Southampton.
Communities
Census-designated places
Other unincorporated communities
- Berlin
- Black Creek
- Drewryville
- Vicksville
Politics
| Year | Republican | Democratic | Third parties |
|---|---|---|---|
| 2016 | 56.8% 5,035 | 40.5% 3,595 | 2.7% 242 |
| 2012 | 51.1% 4,733 | 47.9% 4,437 | 1.0% 94 |
| 2008 | 50.6% 4,583 | 48.6% 4,402 | 0.9% 82 |
| 2004 | 53.6% 4,018 | 45.8% 3,431 | 0.6% 43 |
| 2000 | 49.1% 3,293 | 50.0% 3,359 | 0.9% 62 |
| 1996 | 33.9% 2,275 | 51.4% 3,454 | 14.7% 986 |
| 1992 | 41.4% 2,844 | 46.5% 3,199 | 12.1% 831 |
| 1988 | 53.0% 3,439 | 46.2% 3,000 | 0.8% 54 |
| 1984 | 58.0% 4,669 | 41.0% 3,300 | 1.0% 82 |
| 1980 | 45.5% 2,997 | 50.8% 3,347 | 3.7% 243 |
| 1976 | 40.2% 2,366 | 57.7% 3,399 | 2.1% 124 |
| 1972 | 67.1% 3,225 | 31.2% 1,498 | 1.8% 84 |
| 1968 | 26.2% 1,376 | 34.3% 1,803 | 39.6% 2,083 |
| 1964 | 37.2% 1,520 | 62.7% 2,566 | 0.1% 4 |
| 1960 | 30.6% 1,263 | 68.0% 2,804 | 1.4% 58 |
| 1956 | 35.3% 1,290 | 55.8% 2,039 | 8.9% 326 |
| 1952 | 36.7% 1,166 | 63.0% 2,000 | 0.4% 11 |
| 1948 | 16.1% 339 | 69.6% 1,462 | 14.2% 299 |
| 1944 | 15.0% 284 | 84.4% 1,599 | 0.6% 12 |
| 1940 | 12.3% 213 | 87.0% 1,508 | 0.7% 12 |
| 1936 | 8.1% 148 | 91.6% 1,673 | 0.3% 5 |
| 1932 | 11.7% 182 | 87.2% 1,357 | 1.2% 18 |
| 1928 | 43.4% 648 | 56.6% 844 | |
| 1924 | 14.5% 203 | 79.7% 1,119 | 5.8% 82 |
| 1920 | 15.8% 250 | 83.1% 1,314 | 1.1% 18 |
| 1916 | 10.9% 128 | 89.1% 1,045 | |
| 1912 | 9.4% 95 | 85.0% 861 | 5.6% 57 |
Notable people
- John Brown, fugitive slave
- Anthony W. Gardiner, ninth President of Liberia, established as a US colony in West Africa for free blacks; he emigrated there from Southampton County
- William Mahone, railroad builder, U.S. Senator, and Confederate general
- Dred Scott, slave immortalized by the Dred Scott Decision of the US Supreme Court, which limited the rights of African Americans
- George Henry Thomas, US Army officer
- Nathaniel "Nat" Turner, slave rebellion leader
References
- "Population and Housing Unit Estimates". Retrieved July 14, 2019.
- "State & County QuickFacts". United States Census Bureau. Retrieved January 5, 2014.
- "Find a County". National Association of Counties. Retrieved 2011-06-07.
- "Isle of Wight County". www.lva.virginia.gov. Retrieved 2020-04-10.
- Oates, Stephen B. (1990) [1975]. The Fires of Jubilee: Nat Turner's Fierce Rebellion. New York, New York: HarperCollins Publishers Inc. p. 126. ISBN 0-06-091670-2.
- "US Gazetteer files: 2010, 2000, and 1990". United States Census Bureau. 2011-02-12. Retrieved 2011-04-23.
- "U.S. Decennial Census". United States Census Bureau. Retrieved January 5, 2014.
- "Historical Census Browser". University of Virginia Library. Retrieved January 5, 2014.
- "Population of Counties by Decennial Census: 1900 to 1990". United States Census Bureau. Retrieved January 5, 2014.
- "Census 2000 PHC-T-4. Ranking Tables for Counties: 1990 and 2000" (PDF). United States Census Bureau. Retrieved January 5, 2014.
- "U.S. Census website". United States Census Bureau. Retrieved 2011-05-14.
- Leip, David. "Dave Leip's Atlas of U.S. Presidential Elections". uselectionatlas.org. Retrieved 4 April 2018.
External links
- Southampton County Website
- Hampton Roads Economic Development Alliance – serving Southampton County
- Newsoms Peanut Shop
- Turtle Creek Horse Transportation
Places adjacent to Southampton County, Virginia | |
|---|---|
Municipalities and communities of Southampton County, Virginia, United States | ||
|---|---|---|
| Towns | Map of Virginia highlighting Southampton County | |
| CDPs | ||
| Unincorporated communities | ||

| Authority control |
|
|---|