San Juan County, Colorado
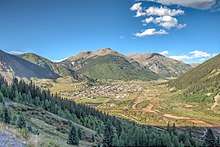
San Juan County is one of the 64 counties of the U.S. state of Colorado. As of the 2010 census, the population was 699,[1] making it the least populous county in Colorado. The county seat and the only incorporated municipality in the county is Silverton.[2] The county name is the Spanish language name for "Saint John", the name Spanish explorers gave to a river and the mountain range in the area. With a mean elevation of 11,240 feet (3426 meters), San Juan County is the highest county in the United States.
San Juan County | |
|---|---|
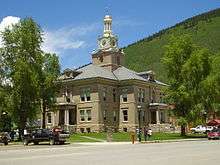
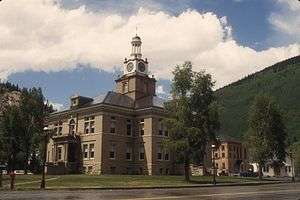 The San Juan County Courthouse in Silverton | |
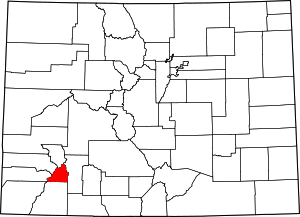 Location within the U.S. state of Colorado | |
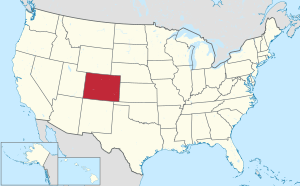 Colorado's location within the U.S. | |
| Coordinates: 37°46′N 107°40′W | |
| Country | |
| State | |
| Founded | January 31, 1876 |
| Named for | Saint John |
| Seat | Silverton |
| Largest town | Silverton |
| Area | |
| • Total | 388 sq mi (1,000 km2) |
| • Land | 387 sq mi (1,000 km2) |
| • Water | 0.8 sq mi (2 km2) 0.2%% |
| Population | |
| • Estimate (2019) | 728 |
| • Density | 1.8/sq mi (0.7/km2) |
| Time zone | UTC−7 (Mountain) |
| • Summer (DST) | UTC−6 (MDT) |
| Congressional district | 3rd |
| Website | www |
History
San Juan County was formed on January 31, 1876, from part of Lake County.
Mining operators in the San Juan mountain area of Colorado formed the San Juan District Mining Association (SJDMA) in 1903, as a direct result of a Western Federation of Miners proposal to the Telluride Mining Association for the eight-hour day, which had been approved in a referendum by 72 percent of Colorado voters.[3] The new association consolidated the power of thirty-six mining properties in San Miguel, Ouray, and San Juan Counties.[4] The SJDMA refused to consider any reduction in hours or increase in wages, helping to provoke a bitter strike.
Geography
According to the U.S. Census Bureau, the county has a total area of 388 square miles (1,000 km2), of which 387 square miles (1,000 km2) is land and 0.8 square miles (2.1 km2) (0.2%) is water.[5] It is the fifth-smallest county in Colorado by area. The County is located in the heart of the San Juan Mountains of Colorado. Though it has the highest mean elevation of any county in the United States, at 11,240 feet (3,426 m), none of Colorado's 53 fourteeners (mountains at least 14,000 feet in elevation) are in San Juan County.
Adjacent counties
- Ouray County – north
- Hinsdale County – east
- La Plata County – south
- Montezuma County – southwest
- Dolores County – west
- San Miguel County – northwest
National protected areas
- Durango-Silverton Narrow-Gauge Railroad National Historic District
- Rio Grande National Forest
- San Juan National Forest
- Shenandoah-Dives (Mayflower) Mill
- Silverton National Historic District
- Uncompahgre National Forest
- Weminuche Wilderness
Trails and byways
- Alpine Loop National Back Country Byway
- Colorado Trail
- Continental Divide National Scenic Trail
- San Juan Skyway National Scenic Byway
Demographics
| Historical population | |||
|---|---|---|---|
| Census | Pop. | %± | |
| 1880 | 1,087 | — | |
| 1890 | 1,572 | 44.6% | |
| 1900 | 2,342 | 49.0% | |
| 1910 | 3,063 | 30.8% | |
| 1920 | 1,700 | −44.5% | |
| 1930 | 1,935 | 13.8% | |
| 1940 | 1,439 | −25.6% | |
| 1950 | 1,471 | 2.2% | |
| 1960 | 849 | −42.3% | |
| 1970 | 831 | −2.1% | |
| 1980 | 833 | 0.2% | |
| 1990 | 745 | −10.6% | |
| 2000 | 558 | −25.1% | |
| 2010 | 699 | 25.3% | |
| Est. 2019 | 728 | [6] | 4.1% |
| U.S. Decennial Census[7] 1790–1960[8] 1900–1990[9] 1990–2000[10] 2010–2015[1] | |||
As of the census of 2000, there were 558 people, 269 households, and 157 families residing in the county. The population density was one person per square mile (1/km²). There were 632 housing units at an average density of 2 per square mile (1/km²). The racial makeup of the county was 97.13% White, 0.72% Native American, 0.18% Asian, 0.36% Pacific Islander, 0.72% from other races, and 0.90% from two or more races. 7.35% of the population were Hispanic or Latino of any race.
There were 269 households out of which 23.80% had children under the age of 18 living with them, 43.90% were married couples living together, 8.90% had a female householder with no husband present, and 41.30% were non-families. 36.80% of all households were made up of individuals and 4.80% had someone living alone who was 65 years of age or older. The average household size was 2.06 and the average family size was 2.63.
In the county, the population was spread out with 20.10% under the age of 18, 4.30% from 18 to 24, 28.10% from 25 to 44, 40.50% from 45 to 64, and 7.00% who were 65 years of age or older. The median age was 44 years. For every 100 females, there were 110.60 males. For every 100 females age 18 and over, there were 112.40 males.
The median income for a household in the county was $30,764, and the median income for a family was $40,000. Males had a median income of $30,588 versus $19,545 for females. The per capita income for the county was $17,584. About 13.50% of families and 20.90% of the population were below the poverty line, including 29.40% of those under age 18 and 7.10% of those age 65 or over.
San Juan county is the only county outside Alaska where walking is the most common form of commute to work. As of 2013, 33% of residents walked to work, 18% drove alone, 19% carpooled, and 18% bicycled, though the small population size introduces considerable margins of error to these statistics.[11]
As of November 2006, the one and only local school had 53 students in grades K–12.
Former Communities
- Animas Forks (restored ghost town)
- Eureka (ghost town)
Politics
In the era of William Jennings Bryan, San Juan County strongly favored the Democratic Party: no Republican managed to carry the county between 1892 and 1916, and it was even one of the few northern or western counties to vote for Alton B. Parker in 1904. It remained a Democratic-leaning county until the 1940s but then turned towards the Republican Party in subsequent decades. No Democratic Presidential nominee won San Juan County between 1968 and 2000, although it was one of fifteen rural or remote counties to give a plurality to Ross Perot in 1992. Since John Kerry carried the county for his party for the first time in four decades at the 2004 election, San Juan County has voted Democratic at the last four Presidential elections.
| Year | Republican | Democratic | Others |
|---|---|---|---|
| 2016 | 42.5% 215 | 52.4% 265 | 5.1% 26 |
| 2012 | 41.9% 212 | 52.6% 266 | 5.5% 28 |
| 2008 | 44.0% 218 | 53.2% 264 | 2.8% 14 |
| 2004 | 44.4% 216 | 52.1% 253 | 3.5% 17 |
| 2000 | 48.2% 210 | 34.2% 149 | 17.7% 77 |
| 1996 | 41.4% 153 | 36.0% 133 | 22.7% 84 |
| 1992 | 26.1% 118 | 32.5% 147 | 41.5% 188 |
| 1988 | 50.4% 210 | 46.0% 192 | 3.6% 15 |
| 1984 | 61.7% 320 | 35.3% 183 | 3.1% 16 |
| 1980 | 48.8% 268 | 26.6% 146 | 24.6% 135 |
| 1976 | 53.8% 221 | 40.6% 167 | 5.6% 23 |
| 1972 | 58.3% 238 | 34.3% 140 | 7.4% 30 |
| 1968 | 46.1% 165 | 37.4% 134 | 16.5% 59 |
| 1964 | 31.7% 129 | 68.3% 278 | 0.0% 0 |
| 1960 | 45.2% 218 | 54.2% 261 | 0.6% 3 |
| 1956 | 58.4% 324 | 41.6% 231 | 0.0% 0 |
| 1952 | 56.8% 432 | 43.0% 327 | 0.3% 2 |
| 1948 | 47.0% 329 | 49.7% 348 | 3.3% 23 |
| 1944 | 55.9% 328 | 44.0% 258 | 0.2% 1 |
| 1940 | 54.2% 452 | 45.3% 378 | 0.5% 4 |
| 1936 | 23.6% 196 | 74.9% 622 | 1.4% 12 |
| 1932 | 22.4% 160 | 76.3% 544 | 1.3% 9 |
| 1928 | 37.1% 277 | 58.5% 436 | 4.4% 33 |
| 1924 | 39.8% 218 | 37.6% 206 | 22.6% 124 |
| 1920 | 50.5% 330 | 44.3% 290 | 5.2% 34 |
| 1916 | 21.6% 214 | 70.0% 693 | 8.4% 83 |
| 1912 | 22.5% 231 | 54.0% 555 | 23.5% 241 |
See also
References
- "State & County QuickFacts". United States Census Bureau. Retrieved June 11, 2014.
- "Find a County". National Association of Counties. Retrieved June 7, 2011.
- Roughneck—The Life and Times of Big Bill Haywood, Peter Carlson, 1983, page 65.
- The Corpse on Boomerang Road, Telluride's War on Labor 1899–1908, MaryJoy Martin, 2004, page 201.
- "US Gazetteer files: 2010, 2000, and 1990". United States Census Bureau. February 12, 2011. Retrieved April 23, 2011.
- "Population and Housing Unit Estimates". Retrieved December 12, 2019.
- "U.S. Decennial Census". United States Census Bureau. Retrieved June 11, 2014.
- "Historical Census Browser". University of Virginia Library. Retrieved June 11, 2014.
- "Population of Counties by Decennial Census: 1900 to 1990". United States Census Bureau. Retrieved June 11, 2014.
- "Census 2000 PHC-T-4. Ranking Tables for Counties: 1990 and 2000" (PDF). United States Census Bureau. Retrieved June 11, 2014.
- "Interactive: How Americans Get to Work". FlowingData. January 20, 2015. Retrieved January 21, 2015.
- Leip, David. "Dave Leip's Atlas of U.S. Presidential Elections". uselectionatlas.org. Retrieved May 26, 2017.
External links
| Wikimedia Commons has media related to San Juan County, Colorado. |
- San Juan County Government website
- Joint Town/County Planning Department
- Silverton Chamber of Commerce
- Colorado County Evolution by Don Stanwyck
- Colorado Historical Society
Places adjacent to San Juan County, Colorado | ||||||||||
|---|---|---|---|---|---|---|---|---|---|---|
| ||||||||||
Municipalities and communities of San Juan County, Colorado, United States | ||
|---|---|---|
| Town | Map of Colorado highlighting San Juan County | |
| Unincorporated communities | ||
| Ghost towns | ||
| Authority control |
|
|---|