Logan County, Colorado
Logan County is one of the 64 counties in the U.S. state of Colorado. As of the 2010 census, the population was 22,709.[1] The county seat is Sterling.[2] The county was named for General John A. Logan.[3]
Logan County | |
|---|---|
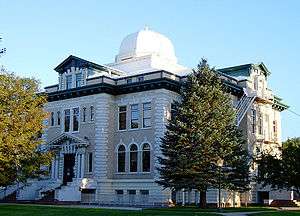 Logan County Courthouse | |
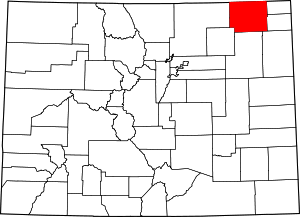 Location within the U.S. state of Colorado | |
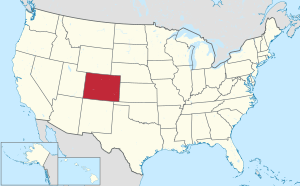 Colorado's location within the U.S. | |
| Coordinates: 40°44′N 103°07′W | |
| Country | |
| State | |
| Founded | February 25, 1887 |
| Named for | John A. Logan |
| Seat | Sterling |
| Largest city | Sterling |
| Area | |
| • Total | 1,845 sq mi (4,780 km2) |
| • Land | 1,839 sq mi (4,760 km2) |
| • Water | 6.3 sq mi (16 km2) 0.3%% |
| Population | |
| • Estimate (2019) | 22,409 |
| • Density | 12/sq mi (5/km2) |
| Time zone | UTC−7 (Mountain) |
| • Summer (DST) | UTC−6 (MDT) |
| Congressional district | 4th |
| Website | www |
Logan County comprises the Sterling, CO Micropolitan Statistical Area.[4][5]
Geography
According to the U.S. Census Bureau, the county has a total area of 1,845 square miles (4,780 km2), of which 1,839 square miles (4,760 km2) is land and 6.3 square miles (16 km2) (0.3%) is water.[6]
Adjacent counties
- Cheyenne County, Nebraska - north
- Phillips County - east
- Sedgwick County - east
- Yuma County - southeast
- Washington County - south
- Morgan County - southwest
- Weld County - west
- Kimball County, Nebraska - northwest
State protected area
Trails and byways
- American Discovery Trail
- Pawnee Pioneer Trails
- South Platte Trail
Demographics
| Historical population | |||
|---|---|---|---|
| Census | Pop. | %± | |
| 1890 | 3,070 | — | |
| 1900 | 3,292 | 7.2% | |
| 1910 | 9,549 | 190.1% | |
| 1920 | 18,427 | 93.0% | |
| 1930 | 19,946 | 8.2% | |
| 1940 | 18,370 | −7.9% | |
| 1950 | 17,187 | −6.4% | |
| 1960 | 20,302 | 18.1% | |
| 1970 | 18,852 | −7.1% | |
| 1980 | 19,800 | 5.0% | |
| 1990 | 17,567 | −11.3% | |
| 2000 | 20,504 | 16.7% | |
| 2010 | 22,709 | 10.8% | |
| Est. 2019 | 22,409 | [7] | −1.3% |
| U.S. Decennial Census[8] 1790-1960[9] 1900-1990[10] 1990-2000[11] 2010-2015[1] | |||
At the 2000 census there were 20,504 people, 7,551 households, and 5,066 families in the county. The population density was 11 people per square mile (4/km²). There were 8,424 housing units at an average density of 5 per square mile (2/km²). The racial makeup of the county was 91.65% White, 2.05% Black or African American, 0.64% Native American, 0.40% Asian, 0.07% Pacific Islander, 3.77% from other races, and 1.43% from two or more races. 11.90% of the population were Hispanic or Latino of any race.[12] Of the 7,551 households 31.90% had children under the age of 18 living with them, 54.80% were married couples living together, 8.60% had a female householder with no husband present, and 32.90% were non-families. 28.50% of households were one person and 12.40% were one person aged 65 or older. The average household size was 2.45 and the average family size was 3.02.
The age distribution was 24.70% under the age of 18, 10.80% from 18 to 24, 28.30% from 25 to 44, 21.70% from 45 to 64, and 14.50% 65 or older. The median age was 36 years. For every 100 females there were 112.00 males. For every 100 females age 18 and over, there were 114.60 males.
The median household income was $32,724 and the median family income was $42,241. Males had a median income of $28,155 versus $21,110 for females. The per capita income for the county was $16,721. About 9.00% of families and 12.20% of the population were below the poverty line, including 13.40% of those under age 18 and 10.90% of those age 65 or over.
Politics
Logan County is strongly Republican in presidential elections. Since 1912, the county has failed to back the Republican candidate in only five presidential elections, most recently in 1964 in the midst of Lyndon B. Johnson's national landslide victory.
| Year | Republican | Democratic | Others |
|---|---|---|---|
| 2016 | 74.9% 7,282 | 19.0% 1,851 | 6.1% 589 |
| 2012 | 67.7% 6,179 | 29.7% 2,712 | 2.6% 233 |
| 2008 | 66.9% 6,002 | 31.7% 2,846 | 1.4% 129 |
| 2004 | 70.4% 6,168 | 28.4% 2,491 | 1.2% 107 |
| 2000 | 68.3% 5,531 | 28.4% 2,296 | 3.3% 269 |
| 1996 | 53.2% 4,032 | 36.5% 2,765 | 10.4% 789 |
| 1992 | 41.0% 3,420 | 32.6% 2,718 | 26.5% 2,207 |
| 1988 | 56.2% 4,485 | 42.4% 3,382 | 1.4% 108 |
| 1984 | 72.3% 5,883 | 26.5% 2,155 | 1.2% 95 |
| 1980 | 63.2% 5,238 | 28.1% 2,332 | 8.7% 723 |
| 1976 | 53.3% 4,256 | 44.4% 3,543 | 2.3% 183 |
| 1972 | 67.3% 5,352 | 30.5% 2,426 | 2.2% 178 |
| 1968 | 57.0% 4,323 | 33.2% 2,521 | 9.8% 747 |
| 1964 | 45.2% 3,497 | 54.6% 4,222 | 0.2% 12 |
| 1960 | 60.0% 5,002 | 40.0% 3,334 | 0.1% 5 |
| 1956 | 64.5% 5,199 | 35.3% 2,841 | 0.3% 20 |
| 1952 | 67.7% 5,237 | 31.8% 2,459 | 0.6% 43 |
| 1948 | 50.0% 3,223 | 49.3% 3,179 | 0.7% 46 |
| 1944 | 61.6% 3,998 | 38.1% 2,471 | 0.3% 18 |
| 1940 | 61.4% 4,613 | 37.5% 2,819 | 1.1% 83 |
| 1936 | 42.6% 3,136 | 55.3% 4,070 | 2.1% 154 |
| 1932 | 45.4% 3,157 | 52.4% 3,641 | 2.1% 149 |
| 1928 | 71.9% 4,377 | 26.6% 1,620 | 1.5% 89 |
| 1924 | 55.6% 3,103 | 17.0% 946 | 27.5% 1,532 |
| 1920 | 59.7% 3,123 | 36.2% 1,893 | 4.1% 214 |
| 1916 | 33.5% 1,422 | 63.1% 2,679 | 3.4% 142 |
| 1912 | 20.2% 664 | 40.7% 1,338 | 39.2% 1,289 |
Communities
City
See also
References
- "State & County QuickFacts". United States Census Bureau. Archived from the original on August 6, 2011. Retrieved February 11, 2014.
- "Find a County". National Association of Counties. Retrieved 2011-06-07.
- Gannett, Henry (1905). The Origin of Certain Place Names in the United States. U.S. Government Printing Office. p. 189.
- "OMB Bulletin No. 10-02: Update of Statistical Area Definitions and Guidance on Their Uses" (PDF). United States Office of Management and Budget. December 1, 2009. Archived from the original (PDF) on March 16, 2012. Retrieved April 19, 2012.
- See the Colorado census statistical areas.
- "US Gazetteer files: 2010, 2000, and 1990". United States Census Bureau. 2011-02-12. Retrieved 2011-04-23.
- "Population and Housing Unit Estimates". Retrieved December 12, 2019.
- "U.S. Decennial Census". United States Census Bureau. Retrieved June 8, 2014.
- "Historical Census Browser". University of Virginia Library. Retrieved June 8, 2014.
- "Population of Counties by Decennial Census: 1900 to 1990". United States Census Bureau. Retrieved June 8, 2014.
- "Census 2000 PHC-T-4. Ranking Tables for Counties: 1990 and 2000" (PDF). United States Census Bureau. Retrieved June 8, 2014.
- "U.S. Census website". United States Census Bureau. Retrieved 2011-05-14.
- Leip, David. "Dave Leip's Atlas of U.S. Presidential Elections". uselectionatlas.org. Retrieved May 26, 2017.
External links
- Logan County Government website
- Colorado County Evolution by Don Stanwyck
- Colorado Historical Society
Places adjacent to Logan County, Colorado | ||||||||||
|---|---|---|---|---|---|---|---|---|---|---|
| ||||||||||
Municipalities and communities of Logan County, Colorado, United States | ||
|---|---|---|
| City | Map of Colorado highlighting Logan County | |
| Towns | ||
| CDPs | ||
| Unincorporated communities | ||
| Authority control |
|
|---|