Rio Grande County, Colorado
Rio Grande County is one of the 64 counties of the U.S. state of Colorado. As of the 2010 census, the population was 11,982.[1] The county seat is Del Norte.[2] The county is named for the Rio Grande (Spanish language for "Big River"), which flows through the county.
Rio Grande County | |
|---|---|
.JPG) | |
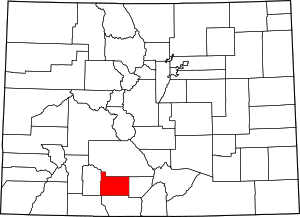 Location within the U.S. state of Colorado | |
 Colorado's location within the U.S. | |
| Coordinates: 37°37′N 106°23′W | |
| Country | |
| State | |
| Founded | February 10, 1874 |
| Named for | Rio Grande |
| Seat | Del Norte |
| Largest city | Monte Vista |
| Area | |
| • Total | 912 sq mi (2,360 km2) |
| • Land | 912 sq mi (2,360 km2) |
| • Water | 0.4 sq mi (1 km2) 0.04%% |
| Population | |
| • Estimate (2019) | 11,267 |
| • Density | 13/sq mi (5/km2) |
| Time zone | UTC−7 (Mountain) |
| • Summer (DST) | UTC−6 (MDT) |
| Congressional district | 3rd |
| Website | www |
Description
The gateway to the San Juan Mountains, Rio Grande County is one of the highlights of the San Luis Valley. The county covers 913 square miles (2,360 km2) ranging from approximately 7,000 feet (2,100 m) on valley floor to several 13,000-foot peaks. There are three municipalities within the county, Monte Vista, Del Norte, and South Fork and all have been historically developed along the rail line that follows the Rio Grande.
Monte Vista is the county's largest community situated on the valley floor. "Monte", as locals people call it, is the center of the agricultural aspect of the county. There are numerous festivals, events, and clubs that take place in and around Monte Vista, and the Monte Vista National Wildlife Refuge is a stop for migratory Sand Hill Cranes every year. Del Norte is a quaint town with a focus on its historic past; it is the county seat, home to the Rio Grande County Museum, and maintains a historic façade in its main street.
The newest town in Rio Grande County is South Fork. South Fork is surrounded by the Rio Grande National Forest and other public lands and has easy access to Wolf Creek Ski Area. Developed as a logging center it has become a gem of the Valley with a booming housing market, world-class 18-hole golf course, and the distinction of being the "Gateway to the Silver Thread" scenic byway.
Geography
According to the U.S. Census Bureau, the county has a total area of 912 square miles (2,360 km2), of which 912 square miles (2,360 km2) is land and 0.4 square miles (1.0 km2) (0.04%) is water.[3]
Adjacent counties
- Saguache County - north
- Alamosa County - east
- Conejos County - south
- Archuleta County - southwest
- Mineral County - west
National protected areas
Trails and byways
- Continental Divide National Scenic Trail
- Old Spanish National Historic Trail
- Silver Thread Scenic Byway
Demographics
| Historical population | |||
|---|---|---|---|
| Census | Pop. | %± | |
| 1880 | 1,944 | — | |
| 1890 | 3,451 | 77.5% | |
| 1900 | 4,080 | 18.2% | |
| 1910 | 6,563 | 60.9% | |
| 1920 | 7,855 | 19.7% | |
| 1930 | 9,953 | 26.7% | |
| 1940 | 12,404 | 24.6% | |
| 1950 | 12,832 | 3.5% | |
| 1960 | 11,160 | −13.0% | |
| 1970 | 10,494 | −6.0% | |
| 1980 | 10,511 | 0.2% | |
| 1990 | 10,770 | 2.5% | |
| 2000 | 12,413 | 15.3% | |
| 2010 | 11,982 | −3.5% | |
| Est. 2019 | 11,267 | [4] | −6.0% |
| U.S. Decennial Census[5] 1790-1960[6] 1900-1990[7] 1990-2000[8] 2010-2015[1] | |||
At the 2000 census there were 12,413 people, 4,701 households, and 3,417 families living in the county. The population density was 14 people per square mile (5/km²). There were 6,003 housing units at an average density of 7 per square mile (3/km²). The racial makeup of the county was 73.93% White, 0.35% Black or African American, 1.26% Native American, 0.23% Asian, 0.02% Pacific Islander, 21.45% from other races, and 2.76% from two or more races. 41.67% of the population were Hispanic or Latino of any race.[9] Of the 4,701 households 35.10% had children under the age of 18 living with them, 57.80% were married couples living together, 11.20% had a female householder with no husband present, and 27.30% were non-families. 24.10% of households were one person and 10.30% were one person aged 65 or older. The average household size was 2.59 and the average family size was 3.08.
The age distribution was 28.10% under the age of 18, 8.00% from 18 to 24, 25.30% from 25 to 44, 23.90% from 45 to 64, and 14.70% 65 or older. The median age was 37 years. For every 100 females there were 97.10 males. For every 100 females age 18 and over, there were 94.40 males.
The median household income was $31,836 and the median family income was $36,809. Males had a median income of $30,432 versus $23,005 for females. The per capita income for the county was $15,650. About 11.30% of families and 14.50% of the population were below the poverty line, including 18.40% of those under age 18 and 11.20% of those age 65 or over.
Politics
| Year | Republican | Democratic | Others |
|---|---|---|---|
| 2016 | 55.8% 3,085 | 36.2% 2,001 | 8.1% 448 |
| 2012 | 52.7% 2,918 | 44.8% 2,478 | 2.5% 137 |
| 2008 | 53.8% 2,930 | 45.0% 2,448 | 1.2% 66 |
| 2004 | 62.4% 3,448 | 36.3% 2,006 | 1.3% 72 |
| 2000 | 61.3% 3,111 | 33.6% 1,707 | 5.1% 257 |
| 1996 | 49.5% 2,129 | 40.0% 1,720 | 10.5% 452 |
| 1992 | 42.5% 1,927 | 34.0% 1,541 | 23.5% 1,065 |
| 1988 | 62.0% 2,626 | 36.5% 1,545 | 1.5% 64 |
| 1984 | 73.3% 3,122 | 25.9% 1,104 | 0.8% 36 |
| 1980 | 63.4% 2,844 | 30.5% 1,370 | 6.1% 274 |
| 1976 | 62.4% 2,627 | 35.0% 1,475 | 2.6% 110 |
| 1972 | 69.7% 2,787 | 25.7% 1,029 | 4.6% 183 |
| 1968 | 58.3% 2,442 | 37.3% 1,562 | 4.4% 183 |
| 1964 | 43.9% 1,699 | 55.9% 2,161 | 0.2% 7 |
| 1960 | 58.5% 2,524 | 41.3% 1,782 | 0.1% 6 |
| 1956 | 66.0% 2,816 | 33.8% 1,441 | 0.2% 7 |
| 1952 | 70.1% 3,201 | 29.6% 1,350 | 0.3% 15 |
| 1948 | 52.9% 2,049 | 46.8% 1,814 | 0.3% 13 |
| 1944 | 65.8% 2,567 | 34.0% 1,325 | 0.2% 8 |
| 1940 | 57.4% 3,075 | 41.9% 2,242 | 0.8% 40 |
| 1936 | 41.6% 1,884 | 56.9% 2,574 | 1.5% 66 |
| 1932 | 36.6% 1,557 | 59.6% 2,539 | 3.8% 162 |
| 1928 | 64.0% 2,254 | 34.8% 1,226 | 1.1% 40 |
| 1924 | 53.5% 1,572 | 31.4% 922 | 15.1% 444 |
| 1920 | 61.0% 1,660 | 36.2% 985 | 2.8% 76 |
| 1916 | 32.6% 886 | 64.6% 1,756 | 2.8% 75 |
| 1912 | 25.0% 698 | 46.0% 1,286 | 29.0% 810 |
Communities
City
Towns
See also
References
- "State & County QuickFacts". United States Census Bureau. Retrieved February 11, 2014.
- "Find a County". National Association of Counties. Retrieved 2011-06-07.
- "US Gazetteer files: 2010, 2000, and 1990". United States Census Bureau. 2011-02-12. Retrieved 2011-04-23.
- "Population and Housing Unit Estimates". Retrieved December 12, 2019.
- "U.S. Decennial Census". United States Census Bureau. Retrieved June 11, 2014.
- "Historical Census Browser". University of Virginia Library. Retrieved June 11, 2014.
- "Population of Counties by Decennial Census: 1900 to 1990". United States Census Bureau. Retrieved June 11, 2014.
- "Census 2000 PHC-T-4. Ranking Tables for Counties: 1990 and 2000" (PDF). United States Census Bureau. Retrieved June 11, 2014.
- "U.S. Census website". United States Census Bureau. Retrieved 2011-05-14.
- Leip, David. "Dave Leip's Atlas of U.S. Presidential Elections". uselectionatlas.org. Retrieved May 26, 2017.
External links
- Rio Grande County Government website
- Colorado County Evolution by Don Stanwyck
- Colorado Historical Society
Places adjacent to Rio Grande County, Colorado | ||||||||||
|---|---|---|---|---|---|---|---|---|---|---|
| ||||||||||
Municipalities and communities of Rio Grande County, Colorado, United States | ||
|---|---|---|
| City | Map of Colorado highlighting Rio Grande County | |
| Towns | ||
| CDPs | ||
| Unincorporated community | ||
| Footnotes | ‡This populated place also has portions in an adjacent county or counties | |
| Authority control |
|
|---|