Bent County, Colorado
Bent County is one of the 64 counties of the U.S. state of Colorado. As of the 2010 census, the population was 6,499.[2] The county seat and only incorporated municipality is Las Animas.[3] The county is named in honor of frontier trader William Bent.
Bent County | |
|---|---|
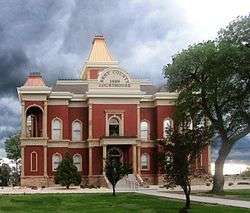 Bent County Courthouse in Las Animas | |
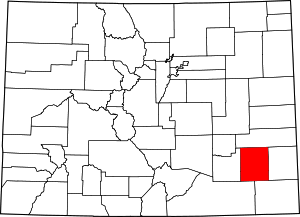 Location within the U.S. state of Colorado | |
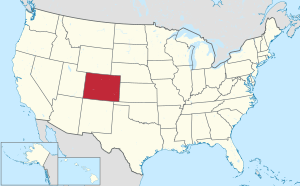 Colorado's location within the U.S. | |
| Coordinates: 37°57′N 103°05′W | |
| Country | |
| State | |
| Founded | February 6, 1874 |
| Named for | William Bent |
| Seat | Las Animas |
| Largest city | Las Animas |
| Area | |
| • Total | 1,541 sq mi (3,990 km2) |
| • Land | 1,513 sq mi (3,920 km2) |
| • Water | 28 sq mi (70 km2) 1.8%% |
| Population | |
| • Estimate (2019) | 5,577[1] |
| • Density | 4.0/sq mi (1.5/km2) |
| Time zone | UTC−7 (Mountain) |
| • Summer (DST) | UTC−6 (MDT) |
| Congressional district | 4th |
| Website | www |
History
As Colorado experienced population growth following the American Civil War, government had to be closer to the people for commerce and justice to be better served in growing communities. Territorial Bent County was created in February 1870, followed by Greenwood County the following month. The June 1, 1870, Federal Census was several months away and there were plans to apply for statehood. On February 2, 1874, Grand County and Elbert County were formed. On February 6, 1874, Greenwood County was dissolved and divided between Bent and Elbert counties. At the time of this annexation, Bent County included a large portion of southeastern Colorado. In 1889, Bent County acquired its current borders when it was partitioned to create Cheyenne, Lincoln, Kiowa, Otero, and Prowers counties.
Geography
According to the U.S. Census Bureau, the county has a total area of 1,541 square miles (3,990 km2), of which 1,513 square miles (3,920 km2) is land and 28 square miles (73 km2) (1.8%) is water.[4]
Adjacent counties
- Kiowa County - north
- Prowers County - east
- Baca County - southeast
- Las Animas County - southwest
- Otero County - west
State protected area
Trails and byway
- American Discovery Trail
- Santa Fe National Historic Trail
- Santa Fe Trail National Scenic Byway
Demographics
| Historical population | |||
|---|---|---|---|
| Census | Pop. | %± | |
| 1870 | 592 | — | |
| 1880 | 1,654 | 179.4% | |
| 1890 | 1,313 | −20.6% | |
| 1900 | 3,049 | 132.2% | |
| 1910 | 5,043 | 65.4% | |
| 1920 | 9,705 | 92.4% | |
| 1930 | 9,134 | −5.9% | |
| 1940 | 9,653 | 5.7% | |
| 1950 | 8,775 | −9.1% | |
| 1960 | 7,419 | −15.5% | |
| 1970 | 6,493 | −12.5% | |
| 1980 | 5,945 | −8.4% | |
| 1990 | 5,048 | −15.1% | |
| 2000 | 5,998 | 18.8% | |
| 2010 | 6,499 | 8.4% | |
| Est. 2019 | 5,577 | [5] | −14.2% |
| U.S. Decennial Census[6] 1790-1960[7] 1900-1990[8] 1990-2000[9] 2010-2015[2] | |||
At the 2000 census, there were 5,998 people, 2,003 households, and 1,388 families in the county. The population density was 4 people per square mile (2/km²). There were 2,366 housing units at an average density of 2 per square mile (1/km²). The racial makeup of the county was 79.53% White, 3.65% Black or African American, 2.23% Native American, 0.57% Asian, 10.25% from other races, and 3.77% from two or more races. 30.24% of the population were Hispanic or Latino of any race.
Of the 2,003 households 32.50% had children under the age of 18 living with them, 53.50% were married couples living together, 11.40% had a female householder with no husband present, and 30.70% were non-families. 27.20% of households were one person and 12.20% were one person aged 65 or older. The average household size was 2.53 and the average family size was 3.07.
The age distribution was 23.80% under the age of 18, 9.30% from 18 to 24, 29.20% from 25 to 44, 21.80% from 45 to 64, and 15.90% 65 or older. The median age was 37 years. For every 100 females there were 129.00 males. For every 100 females age 18 and over, there were 138.70 males.
The median household income was $28,125 and the median family income was $34,096. Males had a median income of $22,755 versus $24,261 for females. The per capita income for the county was $13,567. About 16.60% of families and 19.50% of the population were below the poverty line, including 27.40% of those under age 18 and 13.00% of those age 65 or over.
Politics
Bent is a strongly Republican county, although it is less so than the counties to its east. The last Democrat to carry Bent County was Bill Clinton in 1996, although Michael Dukakis in 1988 was the last to gain a majority.
| Year | Republican | Democratic | Others |
|---|---|---|---|
| 2016 | 61.7% 1,188 | 30.6% 590 | 7.7% 149 |
| 2012 | 55.4% 1,075 | 42.0% 815 | 2.7% 52 |
| 2008 | 56.1% 1,077 | 41.6% 799 | 2.3% 44 |
| 2004 | 62.1% 1,338 | 36.4% 785 | 1.5% 32 |
| 2000 | 55.8% 1,096 | 39.9% 783 | 4.3% 84 |
| 1996 | 41.7% 917 | 47.6% 1,046 | 10.7% 236 |
| 1992 | 33.6% 759 | 43.6% 985 | 22.7% 513 |
| 1988 | 47.6% 1,032 | 50.2% 1,088 | 2.2% 47 |
| 1984 | 59.8% 1,314 | 39.1% 859 | 1.2% 26 |
| 1980 | 51.8% 1,206 | 38.4% 894 | 9.9% 230 |
| 1976 | 46.6% 1,156 | 51.1% 1,268 | 2.3% 56 |
| 1972 | 64.3% 1,525 | 33.2% 787 | 2.5% 60 |
| 1968 | 47.5% 1,228 | 43.5% 1,126 | 9.0% 233 |
| 1964 | 34.8% 937 | 64.4% 1,737 | 0.8% 22 |
| 1960 | 42.3% 1,228 | 57.5% 1,671 | 0.2% 5 |
| 1956 | 57.3% 1,718 | 42.8% 1,283 | 0.0% 0 |
| 1952 | 59.4% 1,950 | 40.1% 1,317 | 0.5% 16 |
| 1948 | 43.4% 1,296 | 55.6% 1,658 | 1.0% 30 |
| 1944 | 51.5% 1,556 | 48.2% 1,456 | 0.3% 9 |
| 1940 | 51.7% 1,899 | 47.9% 1,759 | 0.5% 17 |
| 1936 | 40.8% 1,299 | 57.3% 1,821 | 1.9% 61 |
| 1932 | 39.6% 1,327 | 58.1% 1,948 | 2.3% 78 |
| 1928 | 72.1% 1,957 | 27.3% 741 | 0.6% 15 |
| 1924 | 54.1% 1,511 | 28.8% 804 | 17.1% 476 |
| 1920 | 60.7% 1,584 | 35.9% 937 | 3.5% 90 |
| 1916 | 34.8% 833 | 61.5% 1,473 | 3.7% 88 |
| 1912 | 21.8% 420 | 37.8% 730 | 40.4% 780[lower-alpha 1] |
Communities
Cities
Census-designated place
Gallery
 Statue of cavalry soldier at Bent County Courthouse
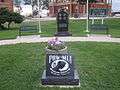 POW-MIA monument at Bent County Courthouse
 Bent County Democrat newspaper in Las Animas
 Bent County rodeo arena
See also
- Outline of Colorado
- Index of Colorado-related articles
- Colorado census statistical areas
- George W. Swink, retailer and cattleman
- Greenwood County, Colorado Territory
- List of counties in Colorado
- National Register of Historic Places listings in Bent County, Colorado
References
- "Population and Housing Unit Estimates". U.S. Census Bureau. August 15, 2017. Retrieved August 15, 2017.
- "State & County QuickFacts". United States Census Bureau. Retrieved June 7, 2014.
- "Find a County". National Association of Counties. Archived from the original on 2011-05-31. Retrieved 2011-06-07.
- "US Gazetteer files: 2010, 2000, and 1990". United States Census Bureau. 2011-02-12. Retrieved 2011-04-23.
- "Population and Housing Unit Estimates". Retrieved December 3, 2019.
- "U.S. Decennial Census". United States Census Bureau. Archived from the original on April 26, 2015. Retrieved June 7, 2014.
- "Historical Census Browser". University of Virginia Library. Retrieved June 7, 2014.
- "Population of Counties by Decennial Census: 1900 to 1990". United States Census Bureau. Retrieved June 7, 2014.
- "Census 2000 PHC-T-4. Ranking Tables for Counties: 1990 and 2000" (PDF). United States Census Bureau. Retrieved June 7, 2014.
- Leip, David. "Dave Leip's Atlas of U.S. Presidential Elections". uselectionatlas.org. Retrieved May 26, 2017.
Notes
- These comprise 680 for Progressive Theodore Roosevelt, 56 for Prohibition Party candidate Eugene Chafin, 38 for Socialist Eugene Debs, and six for the Socialist Labor Party's Arthur Reimer.
External links
- Bent County Government website
- Colorado County Evolution by Don Stanwyck
- Colorado Historical Society
Places adjacent to Bent County, Colorado | ||||||||||
|---|---|---|---|---|---|---|---|---|---|---|
| ||||||||||
Municipalities and communities of Bent County, Colorado, United States | ||
|---|---|---|
| City | Map of Colorado highlighting Bent County | |
| CDP | ||
| Unincorporated communities | ||
| Ghost town | ||
| Authority control |
|
|---|