Routt County, Colorado
Routt County is one of the 64 counties in the U.S. state of Colorado. As of the 2010 census, the population was 23,509.[1] The county seat is Steamboat Springs.[2]
Routt County | |
|---|---|
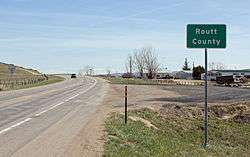 Entering Routt County from the west on U.S. Route 40 | |
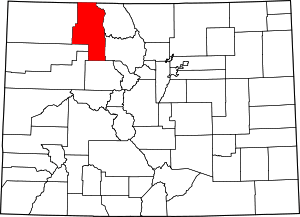 Location within the U.S. state of Colorado | |
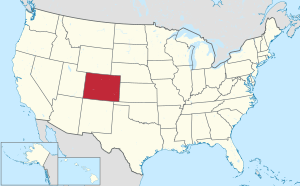 Colorado's location within the U.S. | |
| Coordinates: 40°29′N 106°59′W | |
| Country | |
| State | |
| Founded | January 29, 1877 |
| Named for | John Long Routt |
| Seat | Steamboat Springs |
| Largest city | Steamboat Springs |
| Area | |
| • Total | 2,368 sq mi (6,130 km2) |
| • Land | 2,362 sq mi (6,120 km2) |
| • Water | 6.1 sq mi (16 km2) 0.3%% |
| Population | |
| • Estimate (2019) | 25,638 |
| • Density | 10/sq mi (4/km2) |
| Time zone | UTC−7 (Mountain) |
| • Summer (DST) | UTC−6 (MDT) |
| Congressional district | 3rd |
| Website | www |
Routt County comprises the Steamboat Springs, CO Micropolitan Statistical Area.
History
Placer gold was found near Hahns Peak in 1864 as part of the Colorado Gold Rush.[3]:30
Routt County was created out of the western portion of Grand County on January 29, 1877. It was named in honor of John Long Routt, the last territorial and first state governor of Colorado. The western portion of Routt County was split off to form Moffat County on February 27, 1911.
Geography
According to the U.S. Census Bureau, the county has a total area of 2,368 square miles (6,130 km2), of which 2,362 square miles (6,120 km2) is land and 6.1 square miles (16 km2) (0.3%) is water.[4]
Adjacent counties
- Carbon County, Wyoming - north
- Jackson County - east
- Grand County - southeast
- Eagle County - south
- Garfield County - south-southwest
- Rio Blanco County - southwest
- Moffat County - west
National protected areas
- Mount Zirkel Wilderness
- Routt National Forest
- Sarvis Creek Wilderness
- White River National Forest
State protected areas
Trails and byways
- Continental Divide National Scenic Trail
- Fish Creek Falls National Recreation Trail
- Flat Tops Trail Scenic Byway
- Great Parks Bicycle Route
- Swamp Park National Recreation Trail
Demographics
| Historical population | |||
|---|---|---|---|
| Census | Pop. | %± | |
| 1880 | 140 | — | |
| 1890 | 2,369 | 1,592.1% | |
| 1900 | 3,661 | 54.5% | |
| 1910 | 7,561 | 106.5% | |
| 1920 | 8,948 | 18.3% | |
| 1930 | 9,352 | 4.5% | |
| 1940 | 10,525 | 12.5% | |
| 1950 | 8,940 | −15.1% | |
| 1960 | 5,900 | −34.0% | |
| 1970 | 6,592 | 11.7% | |
| 1980 | 13,404 | 103.3% | |
| 1990 | 14,088 | 5.1% | |
| 2000 | 19,690 | 39.8% | |
| 2010 | 23,509 | 19.4% | |
| Est. 2019 | 25,638 | [5] | 9.1% |
| U.S. Decennial Census[6] 1790-1960[7] 1900-1990[8] 1990-2000[9] 2010-2015[1] | |||
At the 2000 census there were 19,690 people, 7,953 households, and 4,779 families living in the county. The population density was 8 people per square mile (3/km²). There were 11,217 housing units at an average density of 5 per square mile (2/km²). The racial makeup of the county was 96.90% White, 0.13% Black or African American, 0.49% Native American, 0.39% Asian, 0.09% Pacific Islander, 0.73% from other races, and 1.28% from two or more races. 3.22% of the population were Hispanic Latino of any race.[10] Of the 7,953 households 31.10% had children under the age of 18 living with them, 50.60% were married couples living together, 5.80% had a female householder with no husband present, and 39.90% were non-families. 24.40% of households were one person and 3.70% were one person aged 65 or older. The average household size was 2.44 and the average family size was 2.92.
The age distribution was 22.60% under the age of 18, 10.10% from 18 to 24, 36.50% from 25 to 44, 25.70% from 45 to 64, and 5.00% 65 or older. The median age was 35 years. For every 100 females there were 116.60 males. For every 100 females age 18 and over, there were 119.40 males.
The median household income was $53,612 and the median family income was $61,927. Males had a median income of $36,997 versus $26,576 for females. The per capita income for the county was $28,792. About 2.80% of families and 6.10% of the population were below the poverty line, including 5.20% of those under age 18 and 7.70% of those age 65 or over.
Politics
Routt County was formerly a Republican leaning county, but it has started to trend heavily Democratic. In 2016, Hillary Clinton won the county 54–37. The last Republican to win the county was George W. Bush in 2000, when he won the county with a plurality of 46–44. Bill Clinton won pluralities in 1992 and 1996. However, from 1968 to 1988, Republicans won majorities in the county. Lyndon Johnson won Routt by a healthy margin of 63–37 in 1964. Richard Nixon won the county in 1960, taking 54% of the vote to John F. Kennedy's 46%.
| Year | Republican | Democratic | Others |
|---|---|---|---|
| 2016 | 37.4% 5,230 | 54.3% 7,600 | 8.3% 1,156 |
| 2012 | 41.1% 5,469 | 56.7% 7,547 | 2.3% 301 |
| 2008 | 35.8% 4,725 | 62.7% 8,270 | 1.6% 204 |
| 2004 | 44.2% 5,199 | 54.3% 6,392 | 1.5% 171 |
| 2000 | 46.4% 4,472 | 43.7% 4,208 | 9.9% 958 |
| 1996 | 38.5% 3,019 | 46.7% 3,660 | 14.8% 1,158 |
| 1992 | 28.9% 2,358 | 39.1% 3,188 | 32.0% 2,615 |
| 1988 | 51.7% 3,264 | 46.2% 2,922 | 2.1% 133 |
| 1984 | 66.2% 4,239 | 32.0% 2,051 | 1.8% 118 |
| 1980 | 53.3% 3,574 | 29.0% 1,944 | 17.7% 1,184 |
| 1976 | 54.1% 2,822 | 40.9% 2,130 | 5.0% 261 |
| 1972 | 59.3% 2,629 | 36.4% 1,613 | 4.3% 189 |
| 1968 | 53.8% 1,602 | 36.2% 1,076 | 10.0% 298 |
| 1964 | 36.9% 1,095 | 62.5% 1,853 | 0.5% 16 |
| 1960 | 53.8% 1,651 | 46.1% 1,414 | 0.1% 2 |
| 1956 | 57.6% 1,811 | 42.3% 1,330 | 0.2% 6 |
| 1952 | 57.3% 2,143 | 42.1% 1,575 | 0.6% 21 |
| 1948 | 40.9% 1,492 | 57.2% 2,088 | 1.9% 71 |
| 1944 | 48.8% 1,869 | 50.6% 1,940 | 0.6% 22 |
| 1940 | 44.1% 2,212 | 55.3% 2,775 | 0.6% 32 |
| 1936 | 33.7% 1,541 | 61.6% 2,817 | 4.7% 217 |
| 1932 | 35.6% 1,568 | 60.0% 2,643 | 4.5% 198 |
| 1928 | 57.4% 2,304 | 41.0% 1,645 | 1.7% 68 |
| 1924 | 53.5% 1,822 | 32.8% 1,116 | 13.7% 467 |
| 1920 | 57.5% 1,854 | 38.0% 1,224 | 4.5% 146 |
| 1916 | 28.8% 849 | 66.8% 1,972 | 4.4% 131 |
| 1912 | 26.1% 738 | 49.8% 1,408 | 24.1% 680 |
Communities
City
Census-designated place
Other places
See also
- Outline of Colorado
- Index of Colorado-related articles
- Colorado counties
- Colorado municipalities
- National Register of Historic Places listings in Routt County, Colorado
References
- "State & County QuickFacts". United States Census Bureau. Retrieved February 11, 2014.
- "Find a County". National Association of Counties. Retrieved 2011-06-07.
- Voynick, S.M., 1992, Colorado Gold, Missoula: Mountain Press Publishing Company, ISBN 0878424555
- "US Gazetteer files: 2010, 2000, and 1990". United States Census Bureau. 2011-02-12. Retrieved 2011-04-23.
- "Population and Housing Unit Estimates". Retrieved December 12, 2019.
- "U.S. Decennial Census". United States Census Bureau. Retrieved June 11, 2014.
- "Historical Census Browser". University of Virginia Library. Retrieved June 11, 2014.
- "Population of Counties by Decennial Census: 1900 to 1990". United States Census Bureau. Retrieved June 11, 2014.
- "Census 2000 PHC-T-4. Ranking Tables for Counties: 1990 and 2000" (PDF). United States Census Bureau. Retrieved June 11, 2014.
- "U.S. Census website". United States Census Bureau. Retrieved 2011-05-14.
- Leip, David. "Dave Leip's Atlas of U.S. Presidential Elections". uselectionatlas.org. Retrieved May 26, 2017.
External links
- Routt County Government website
- Colorado County Evolution by Don Stanwyck
- Colorado Historical Society
Places adjacent to Routt County, Colorado | ||||||||||
|---|---|---|---|---|---|---|---|---|---|---|
| ||||||||||
Municipalities and communities of Routt County, Colorado, United States | ||
|---|---|---|
| City | Map of Colorado highlighting Routt County | |
| Towns | ||
| CDP | ||
| Unincorporated communities | ||
| Ghost towns | ||