Gilpin County, Colorado
Gilpin County is the second-least extensive of the 64 counties of the U.S. state of Colorado, behind only the City and County of Broomfield. As of the 2010 census, the population was 5,441.[1] The county seat is Central City.[2] The county was formed in 1861, while Colorado was still a Territory, and was named after Colonel William Gilpin,[3] the first territorial governor.
Gilpin County | |
|---|---|
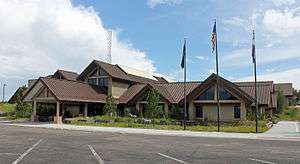 The Gilpin Combined Court, the county courthouse. | |
 Seal | |
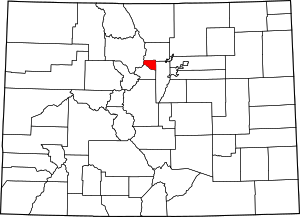 Location within the U.S. state of Colorado | |
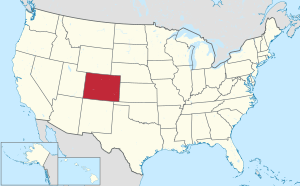 Colorado's location within the U.S. | |
| Coordinates: 39°52′N 105°31′W | |
| Country | |
| State | |
| Founded | November 1, 1861 |
| Named for | William Gilpin |
| Seat | Central City |
| Largest city | Central City |
| Area | |
| • Total | 150 sq mi (400 km2) |
| • Land | 150 sq mi (400 km2) |
| • Water | 0.4 sq mi (1 km2) 0.2%% |
| Population | |
| • Estimate (2019) | 6,243 |
| • Density | 36/sq mi (14/km2) |
| Time zone | UTC−7 (Mountain) |
| • Summer (DST) | UTC−6 (MDT) |
| Congressional district | 2nd |
| Website | www |
Gilpin County is part of the Denver-Aurora-Lakewood, CO Metropolitan Statistical Area.
Geography
According to the U.S. Census Bureau, the county has a total area of 150 square miles (390 km2), of which 150 square miles (390 km2) is land and 0.4 square miles (1.0 km2) (0.2%) is water.[4] It is the second-smallest county by area in Colorado.
Adjacent counties
- Boulder County – north
- Jefferson County – east
- Clear Creek County – south
- Grand County – west
National protected areas
State protected area
Scenic trail and byway
- Continental Divide National Scenic Trail
- Peak to Peak Scenic and Historic Byway
Demographics
| Historical population | |||
|---|---|---|---|
| Census | Pop. | %± | |
| 1870 | 5,490 | — | |
| 1880 | 6,489 | 18.2% | |
| 1890 | 5,867 | −9.6% | |
| 1900 | 6,690 | 14.0% | |
| 1910 | 4,131 | −38.3% | |
| 1920 | 1,364 | −67.0% | |
| 1930 | 1,212 | −11.1% | |
| 1940 | 1,625 | 34.1% | |
| 1950 | 850 | −47.7% | |
| 1960 | 685 | −19.4% | |
| 1970 | 1,272 | 85.7% | |
| 1980 | 2,441 | 91.9% | |
| 1990 | 3,070 | 25.8% | |
| 2000 | 4,757 | 55.0% | |
| 2010 | 5,441 | 14.4% | |
| Est. 2019 | 6,243 | [5] | 14.7% |
| U.S. Decennial Census[6] 1790-1960[7] 1900-1990[8] 1990-2000[9] 2010-2015[1] | |||
At the 2000 census there were 4,757 people, 2,043 households, and 1,264 families in the county. The population density was 32 people per square mile (12/km2). There were 2,929 housing units at an average density of 20 per square mile (8/km2). The racial makeup of the county was 94.37% White, 0.53% Black or African American, 0.82% Native American, 0.69% Asian, 0.19% Pacific Islander, 1.53% from other races, and 1.87% from two or more races. 4.25% of the population were Hispanic or Latino of any race.[10] Of the 2,043 households 26.90% had children under the age of 18 living with them, 53.00% were married couples living together, 5.70% had a female householder with no husband present, and 38.10% were non-families. 26.80% of households were one person and 3.70% were one person aged 65 or older. The average household size was 2.32 and the average family size was 2.81.
The age distribution was 21.10% under the age of 18, 5.80% from 18 to 24, 37.40% from 25 to 44, 30.00% from 45 to 64, and 5.70% 65 or older. The median age was 38 years. For every 100 females there were 112.70 males. For every 100 females age 18 and over, there were 116.10 males.
The median household income was $51,942 and the median family income was $61,859. Males had a median income of $38,560 versus $30,820 for females. The per capita income for the county was $26,148. About 1.00% of families and 4.00% of the population were below the poverty line, including 1.40% of those under age 18 and 6.10% of those age 65 or over.
Politics
| Year | Republican | Democratic | Others |
|---|---|---|---|
| 2016 | 43.8% 1,566 | 45.7% 1,634 | 10.5% 376 |
| 2012 | 40.3% 1,346 | 56.7% 1,892 | 3.0% 100 |
| 2008 | 38.1% 1,283 | 59.1% 1,990 | 2.9% 96 |
| 2004 | 41.6% 1,329 | 56.5% 1,807 | 1.9% 60 |
| 2000 | 40.8% 1,006 | 44.6% 1,099 | 14.6% 360 |
| 1996 | 38.1% 682 | 44.7% 799 | 17.2% 308 |
| 1992 | 26.3% 462 | 41.3% 726 | 32.5% 571 |
| 1988 | 45.8% 728 | 50.6% 804 | 3.7% 58 |
| 1984 | 57.0% 896 | 40.4% 634 | 2.6% 41 |
| 1980 | 50.0% 694 | 31.8% 441 | 18.2% 252 |
| 1976 | 41.2% 451 | 51.4% 563 | 7.4% 81 |
| 1972 | 57.0% 516 | 40.0% 362 | 3.0% 27 |
| 1968 | 52.6% 358 | 32.0% 218 | 15.4% 105 |
| 1964 | 38.8% 233 | 60.5% 363 | 0.7% 4 |
| 1960 | 58.6% 315 | 41.5% 223 | 0.0% 0 |
| 1956 | 61.7% 394 | 38.2% 244 | 0.2% 1 |
| 1952 | 60.4% 357 | 38.6% 228 | 1.0% 6 |
| 1948 | 49.4% 302 | 48.5% 296 | 2.1% 13 |
| 1944 | 55.9% 272 | 43.7% 213 | 0.4% 2 |
| 1940 | 48.7% 413 | 50.8% 431 | 0.6% 5 |
| 1936 | 29.8% 321 | 68.3% 736 | 1.9% 20 |
| 1932 | 32.5% 271 | 64.6% 539 | 3.0% 25 |
| 1928 | 55.2% 299 | 43.5% 236 | 1.3% 7 |
| 1924 | 54.8% 361 | 24.4% 161 | 20.8% 137 |
| 1920 | 67.0% 416 | 30.4% 189 | 2.6% 16 |
| 1916 | 34.2% 407 | 64.1% 763 | 1.8% 21 |
| 1912 | 26.7% 443 | 56.0% 931 | 17.3% 288 |
Communities

Cities
Census-designated places
- Coal Creek (also in Boulder and Jefferson counties)
- Rollinsville
Other
Historic district
See also
- Outline of Colorado
- Index of Colorado-related articles
- Arapahoe County, Kansas Territory
- Montana County, Jefferson Territory
- Colorado census statistical areas
- Denver-Aurora-Boulder Combined Statistical Area
- Front Range Urban Corridor
- Hidee Gold Mine
- National Register of Historic Places listings in Gilpin County, Colorado
References
- "State & County QuickFacts". United States Census Bureau. Archived from the original on June 6, 2011. Retrieved January 25, 2014.
- "Find a County". National Association of Counties. Archived from the original on 2011-05-31. Retrieved 2011-06-07.
- Gannett, Henry (1905). The Origin of Certain Place Names in the United States. Govt. Print. Off. pp. 138.
- "US Gazetteer files: 2010, 2000, and 1990". United States Census Bureau. 2011-02-12. Retrieved 2011-04-23.
- "Population and Housing Unit Estimates". Retrieved December 3, 2019.
- "U.S. Decennial Census". United States Census Bureau. Retrieved June 8, 2014.
- "Historical Census Browser". University of Virginia Library. Retrieved June 8, 2014.
- "Population of Counties by Decennial Census: 1900 to 1990". United States Census Bureau. Retrieved June 8, 2014.
- "Census 2000 PHC-T-4. Ranking Tables for Counties: 1990 and 2000" (PDF). United States Census Bureau. Retrieved June 8, 2014.
- "U.S. Census website". United States Census Bureau. Retrieved 2011-05-14.
- Leip, David. "Dave Leip's Atlas of U.S. Presidential Elections". uselectionatlas.org. Retrieved May 26, 2017.
External links
| Wikimedia Commons has media related to Gilpin County, Colorado. |
- Gilpin County Government website
- Colorado County Evolution by Don Stanwyck
- Colorado Historical Society
Places adjacent to Gilpin County, Colorado | ||||||||||
|---|---|---|---|---|---|---|---|---|---|---|
| ||||||||||
Municipalities and communities of Gilpin County, Colorado, United States | ||
|---|---|---|
| Cities | Map of Colorado highlighting Gilpin County | |
| CDPs | ||
| Unincorporated communities | ||
| Footnotes | ‡This populated place also has portions in an adjacent county or counties | |
| Authority control |
|
|---|