Marshall County, Indiana
Marshall County is a county located in the U.S. state of Indiana. Census 2010 recorded the population at 47,051.[1] The county seat is Plymouth.[2]
Marshall County | |
|---|---|
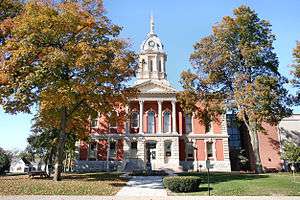 Marshall County courthouse in Plymouth, Indiana | |
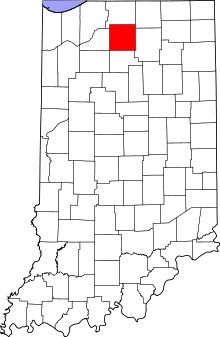 Location within the U.S. state of Indiana | |
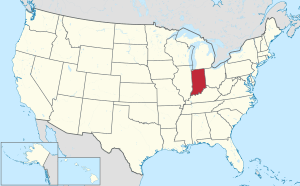 Indiana's location within the U.S. | |
| Coordinates: 41°20′N 86°16′W | |
| Country | |
| State | |
| Founded | 1836 |
| Named for | John Marshall |
| Seat | Plymouth |
| Largest city | Plymouth |
| Area | |
| • Total | 449.74 sq mi (1,164.8 km2) |
| • Land | 443.63 sq mi (1,149.0 km2) |
| • Water | 6.11 sq mi (15.8 km2) 1.36%% |
| Population | |
| • Estimate (2018) | 46,248 |
| • Density | 106/sq mi (40.88/km2) |
| Time zone | UTC−5 (Eastern) |
| • Summer (DST) | UTC−4 (EDT) |
| Congressional district | 2nd |
| Website | www |
| Indiana county number 50 | |
History
Marshall County was formed in 1836, during the early years of settlement and before the forced removal of the Potawatomi people in 1838. It was named for U.S. Chief Justice John Marshall, who died in 1835.[3] The first settlers arrived in what is now Marshall County in 1835. They arrived as a result of the end of the Black Hawk War as well as the completion of the Erie Canal. They consisted primarily of settlers from New England, "Yankees" descended from the English Puritans who settled New England in the colonial era. They were mainly members of the Congregational Church, although due to the Second Great Awakening many of them had converted to Methodism and some had become Baptists before coming to what is now Marshall County. As a result of this heritage, some place names in Marshall County are named after places in New England, such as Plymouth, which is named after Plymouth, Massachusetts, the site where the Mayflower landed in 1620.[4]
Geography
According to the 2010 census, the county has a total area of 449.74 square miles (1,164.8 km2), of which 443.63 square miles (1,149.0 km2) (or 98.64%) is land and 6.11 square miles (15.8 km2) (or 1.36%) is water.[5] The Yellow River flows through northern, central, and western portions of Marshall County, past Plymouth; the Tippecanoe River flows through the southeastern part of the county.[6]
Adjacent counties
- St. Joseph County (north)
- Elkhart County (northeast)
- Kosciusko County (east)
- Fulton County (south)
- Pulaski County (southwest)
- Starke County (west/CST Border)
Climate and weather
| Plymouth, Indiana | ||||||||||||||||||||||||||||||||||||||||||||||||||||||||||||
|---|---|---|---|---|---|---|---|---|---|---|---|---|---|---|---|---|---|---|---|---|---|---|---|---|---|---|---|---|---|---|---|---|---|---|---|---|---|---|---|---|---|---|---|---|---|---|---|---|---|---|---|---|---|---|---|---|---|---|---|---|
| Climate chart (explanation) | ||||||||||||||||||||||||||||||||||||||||||||||||||||||||||||
| ||||||||||||||||||||||||||||||||||||||||||||||||||||||||||||
| ||||||||||||||||||||||||||||||||||||||||||||||||||||||||||||
In recent years, average temperatures in Plymouth have ranged from a low of 16 °F (−9 °C) in January to a high of 86 °F (30 °C) in July, although a record low of −25 °F (−32 °C) was recorded in January 1985 and a record high of 109 °F (43 °C) was recorded in July 1936. Average monthly precipitation ranged from 1.86 inches (47 mm) in February to 4.48 inches (114 mm) in June.[7]
Government
The county government is a constitutional body, and is granted specific powers by the Constitution of Indiana, and by the Indiana Code.
County council: The county council is the legislative branch of the county government and controls all the spending and revenue collection in the county. Representatives are elected from county districts. The council members serve four-year terms. They are responsible for setting salaries, the annual budget, and special spending. The council also has limited authority to impose local taxes, in the form of an income and property tax that is subject to state level approval, excise taxes, and service taxes.[8][9]
Board of commissioners: The executive body of the county is made of a board of commissioners. The commissioners are elected county-wide, in staggered terms, and each serves a four-year term. One of the commissioners, typically the most senior, serves as president. The commissioners are charged with executing the acts legislated by the council, collecting revenue, and managing the day-to-day functions of the county government.[8][9]
Current commissioners: Stan Klotz, Mike Burroughs, Kevin Overmyer
Court: The county maintains a small claims court that can handle some civil cases. The judge on the court is elected to a term of four years and must be a member of the Indiana Bar Association. The judge is assisted by a constable who is also elected to a four-year term. In some cases, court decisions can be appealed to the state level circuit court.[9]
County Officials: The county has several other elected offices, including sheriff, coroner, auditor, treasurer, recorder, surveyor, and circuit court clerk Each of these elected officers serves a term of four years and oversees a different part of county government. Members elected to county government positions are required to declare party affiliations and to be residents of the county.[9]
Marshall County is part of Indiana's 2nd congressional district and is currently represented by Jackie Walorski in the United States Congress.[10] It is also part of Indiana Senate districts 5 and 9[11] and Indiana House of Representatives districts 17 and 23.[12]
| Year | Republican | Democratic | Third parties |
|---|---|---|---|
| 2016 | 67.4% 12,288 | 26.3% 4,798 | 6.3% 1,155 |
| 2012 | 63.3% 11,260 | 34.5% 6,137 | 2.3% 404 |
| 2008 | 56.0% 10,406 | 42.5% 7,889 | 1.5% 276 |
| 2004 | 67.8% 12,074 | 31.4% 5,593 | 0.8% 147 |
| 2000 | 63.6% 10,266 | 34.3% 5,541 | 2.1% 343 |
| 1996 | 52.8% 8,158 | 35.5% 5,486 | 11.6% 1,796 |
| 1992 | 48.6% 8,048 | 29.7% 4,912 | 21.8% 3,607 |
| 1988 | 65.4% 10,490 | 34.2% 5,488 | 0.4% 60 |
| 1984 | 68.8% 11,100 | 30.5% 4,931 | 0.7% 113 |
| 1980 | 62.2% 10,209 | 31.2% 5,113 | 6.6% 1,089 |
| 1976 | 59.2% 9,707 | 39.2% 6,424 | 1.7% 277 |
| 1972 | 73.0% 11,908 | 26.7% 4,349 | 0.3% 51 |
| 1968 | 56.7% 9,290 | 32.9% 5,385 | 10.5% 1,719 |
| 1964 | 48.1% 7,895 | 51.2% 8,397 | 0.8% 123 |
| 1960 | 62.5% 10,460 | 37.1% 6,210 | 0.4% 74 |
| 1956 | 65.7% 10,504 | 33.8% 5,398 | 0.5% 80 |
| 1952 | 63.1% 9,990 | 35.0% 5,538 | 1.9% 300 |
| 1948 | 57.0% 7,873 | 41.0% 5,661 | 2.1% 285 |
| 1944 | 59.9% 8,225 | 38.3% 5,254 | 1.9% 257 |
| 1940 | 56.4% 7,718 | 42.8% 5,852 | 0.8% 111 |
| 1936 | 47.2% 6,118 | 51.3% 6,651 | 1.6% 202 |
| 1932 | 39.8% 4,943 | 58.1% 7,212 | 2.0% 252 |
| 1928 | 60.2% 6,738 | 39.1% 4,377 | 0.6% 70 |
| 1924 | 53.2% 5,354 | 42.5% 4,277 | 4.3% 429 |
| 1920 | 53.6% 5,708 | 43.5% 4,631 | 2.9% 303 |
| 1916 | 44.6% 2,855 | 50.4% 3,221 | 5.0% 320 |
| 1912 | 20.2% 1,196 | 48.3% 2,859 | 31.5% 1,863 |
| 1908 | 45.3% 2,947 | 50.5% 3,287 | 4.2% 270 |
| 1904 | 48.4% 3,001 | 46.4% 2,878 | 5.2% 323 |
| 1900 | 45.1% 2,947 | 52.8% 3,449 | 2.1% 135 |
| 1896 | 44.5% 2,938 | 54.3% 3,588 | 1.3% 83 |
| 1892 | 43.4% 2,558 | 52.8% 3,113 | 3.8% 222 |
| 1888 | 43.7% 2,582 | 54.0% 3,188 | 2.3% 138 |
Demographics
| Historical population | |||
|---|---|---|---|
| Census | Pop. | %± | |
| 1840 | 1,651 | — | |
| 1850 | 5,348 | 223.9% | |
| 1860 | 12,722 | 137.9% | |
| 1870 | 20,211 | 58.9% | |
| 1880 | 23,414 | 15.8% | |
| 1890 | 23,818 | 1.7% | |
| 1900 | 25,119 | 5.5% | |
| 1910 | 24,175 | −3.8% | |
| 1920 | 23,744 | −1.8% | |
| 1930 | 25,077 | 5.6% | |
| 1940 | 25,935 | 3.4% | |
| 1950 | 29,468 | 13.6% | |
| 1960 | 32,443 | 10.1% | |
| 1970 | 34,986 | 7.8% | |
| 1980 | 39,155 | 11.9% | |
| 1990 | 42,182 | 7.7% | |
| 2000 | 45,128 | 7.0% | |
| 2010 | 47,051 | 4.3% | |
| Est. 2018 | 46,248 | [14] | −1.7% |
| U.S. Decennial Census[15] 1790-1960[16] 1900-1990[17] 1990-2000[18] 2010-2013[1] | |||
As of the 2010 United States Census, there were 47,051 people, 17,406 households, and 12,516 families residing in the county.[19] The population density was 106.1 inhabitants per square mile (41.0/km2). There were 19,845 housing units at an average density of 44.7 per square mile (17.3/km2).[5] The racial makeup of the county was 93.5% white, 0.5% black or African American, 0.5% Asian, 0.2% American Indian, 3.8% from other races, and 1.5% from two or more races. Those of Hispanic or Latino origin made up 8.4% of the population.[19] In terms of ancestry, 35.4% were German, 11.2% were Irish, 9.4% were American, and 8.5% were English.[20]
Of the 17,406 households, 35.2% had children under the age of 18 living with them, 57.2% were married couples living together, 9.9% had a female householder with no husband present, 28.1% were non-families, and 24.1% of all households were made up of individuals. The average household size was 2.66 and the average family size was 3.15. The median age was 38.4 years.[19]
The median income for a household in the county was $47,697 and the median income for a family was $58,017. Males had a median income of $43,732 versus $30,033 for females. The per capita income for the county was $22,493. About 8.7% of families and 12.2% of the population were below the poverty line, including 17.1% of those under age 18 and 10.4% of those age 65 or over.[21]
References
- "Marshall County QuickFacts". United States Census Bureau. Archived from the original on June 7, 2011. Retrieved September 25, 2011.
- "Find a County". National Association of Counties. Retrieved June 7, 2011.
- De Witt Clinton Goodrich & Charles Richard Tuttle (1875). An Illustrated History of the State of Indiana. Indiana: R. S. Peale & co. pp. 567.
- A Twentieth Century History of Marshall County, Indiana, Volume 1 By Daniel McDonald
- "Population, Housing Units, Area, and Density: 2010 - County". United States Census Bureau. Archived from the original on February 12, 2020. Retrieved July 10, 2015.
- Indiana Atlas & Gazetteer. Yarmouth, Me.: DeLorme. 1998. pp. 20–21, 26–27. ISBN 0-89933-211-0.
- "Monthly Averages for Plymouth, Indiana". The Weather Channel. Retrieved January 27, 2011.
- Indiana Code. "Title 36, Article 2, Section 3". IN.gov. Retrieved September 16, 2008.
- Indiana Code. "Title 2, Article 10, Section 2" (PDF). IN.gov. Retrieved September 16, 2008.
- "US Congresswoman Jackie Walorski". US Congress. Archived from the original on May 16, 2008. Retrieved August 5, 2019.
- "Indiana Senate Districts". State of Indiana. Retrieved July 14, 2011.
- "Indiana House Districts". State of Indiana. Retrieved July 14, 2011.
- Leip, David. "Dave Leip's Atlas of U.S. Presidential Elections". uselectionatlas.org. Retrieved May 18, 2018.
- "Population and Housing Unit Estimates". Retrieved July 26, 2019.
- "U.S. Decennial Census". United States Census Bureau. Retrieved July 10, 2014.
- "Historical Census Browser". University of Virginia Library. Retrieved July 10, 2014.
- "Population of Counties by Decennial Census: 1900 to 1990". United States Census Bureau. Retrieved July 10, 2014.
- "Census 2000 PHC-T-4. Ranking Tables for Counties: 1990 and 2000" (PDF). United States Census Bureau. Retrieved July 10, 2014.
- "DP-1 Profile of General Population and Housing Characteristics: 2010 Demographic Profile Data". United States Census Bureau. Archived from the original on February 13, 2020. Retrieved July 10, 2015.
- "DP02 SELECTED SOCIAL CHARACTERISTICS IN THE UNITED STATES – 2006-2010 American Community Survey 5-Year Estimates". United States Census Bureau. Archived from the original on February 14, 2020. Retrieved July 10, 2015.
- "DP03 SELECTED ECONOMIC CHARACTERISTICS – 2006-2010 American Community Survey 5-Year Estimates". United States Census Bureau. Archived from the original on February 14, 2020. Retrieved July 10, 2015.
Places adjacent to Marshall County, Indiana | ||||||||||
|---|---|---|---|---|---|---|---|---|---|---|
| ||||||||||
Municipalities and communities of Marshall County, Indiana, United States | ||
|---|---|---|
| City | Map of Indiana highlighting Marshall County | |
| Towns | ||
| Townships | ||
| CDP | ||
| Unincorporated communities | ||
| Footnotes | ‡This populated place also has portions in an adjacent county or counties | |
| Authority control |
|
|---|