1996 United States presidential election in Indiana
The 1996 United States presidential election in Indiana took place on November 5, 1996 as part of the 1996 United States presidential election. Voters chose 12 representatives, or electors to the Electoral College, who voted for president and vice president.
| |||||||||||||||||||||||||||||||||
| |||||||||||||||||||||||||||||||||
 County Results
| |||||||||||||||||||||||||||||||||
| |||||||||||||||||||||||||||||||||
| Elections in Indiana | ||||||
|---|---|---|---|---|---|---|
 | ||||||
|
||||||
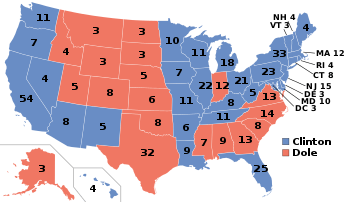
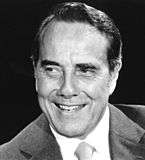
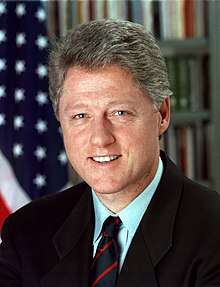
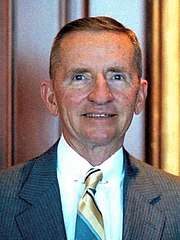
Indiana was won by Senator Bob Dole (R-KS). The presidential contest in Indiana was not a surprise, with Dole winning 47.13% to 41.55% over President Bill Clinton (D) by a margin of 5.58%.[1] Billionaire businessman Ross Perot (Reform Party of the United States of America-TX) finished in third, with a significant 10.50% of the popular vote.[1] Indiana would stay a Republican state until 2008, in which Barack Obama won by a close margin, the first Democratic victory in Indiana since 1964.
Clinton did manage the feat of winning a plurality in exurban Chicago’s Porter County, which had previously voted Republican at every presidential election since that party was founded in 1854.[2] In doing so he broke the second-last still-standing streak of voting Republican from that party’s first election in 1856, leaving Illinois’ Carroll County as the solitary county to have voted Republican at every presidential election since that party’s formation. (Carroll County would eventually have its streak broken by Barack Obama in 2008.)
As of the 2016 presidential election, this is the last election in which Blackford County, Sullivan County, Crawford County, Jefferson County, Knox County, Clark County, Posey County, Switzerland County, Pike County, Floyd County, Gibson County, and Warrick County voted for a Democratic Presidential candidate.[3]
Results
| 1996 United States presidential election in Indiana[1] | ||||||
|---|---|---|---|---|---|---|
| Party | Candidate | Running mate | Votes | Percentage | Electoral votes | |
| Republican | Bob Dole | Jack Kemp | 1,006,693 | 47.13% | 12 | |
| Democratic | Bill Clinton | Al Gore | 887,424 | 41.55% | 0 | |
| Reform | Ross Perot | Patrick Choate | 224,299 | 10.50% | 0 | |
| Libertarian | Harry Browne | Jo Jorgensen | 15,632 | 0.73% | 0 | |
| Write-ins | Various candidates | — | 1,794 | 0.18% | 0 | |
| Totals | 2,135,842 | 100.00% | 12 | |||
Results by county
| County | Robert Joseph Dole Republican |
William Jefferson Clinton Democratic |
Henry Ross Perot Reform |
Various candidates Other parties |
Margin | Total votes cast[4] | |||||
|---|---|---|---|---|---|---|---|---|---|---|---|
| # | % | # | % | # | % | # | % | # | % | ||
| Adams | 6,960 | 55.44% | 4,247 | 33.83% | 1,346 | 10.72% | 2,713 | 21.61% | 12,553 | ||
| Allen | 59,255 | 54.11% | 41,450 | 37.85% | 8,808 | 8.04% | 17,805 | 16.26% | 109,513 | ||
| Bartholomew | 13,188 | 52.12% | 9,301 | 36.76% | 2,815 | 11.12% | 3,887 | 15.36% | 25,304 | ||
| Benton | 1,947 | 50.35% | 1,311 | 33.90% | 609 | 15.75% | 636 | 16.45% | 3,867 | ||
| Blackford | 2,070 | 40.70% | 2,335 | 45.91% | 681 | 13.39% | -265 | -5.21% | 5,086 | ||
| Boone | 11,338 | 64.93% | 4,625 | 26.49% | 1,498 | 8.58% | 6,713 | 38.45% | 17,461 | ||
| Brown | 2,988 | 48.17% | 2,413 | 38.90% | 802 | 12.93% | 575 | 9.27% | 6,203 | ||
| Carroll | 4,062 | 50.90% | 2,747 | 34.42% | 1,171 | 14.67% | 1,315 | 16.48% | 7,980 | ||
| Cass | 8,020 | 51.85% | 5,419 | 35.03% | 2,029 | 13.12% | 2,601 | 16.82% | 15,468 | ||
| Clark | 14,396 | 40.24% | 17,799 | 49.76% | 3,578 | 10.00% | -3,403 | -9.51% | 35,773 | ||
| Clay | 4,858 | 49.22% | 3,605 | 36.53% | 1,406 | 14.25% | 1,253 | 12.70% | 9,869 | ||
| Clinton | 6,156 | 53.72% | 3,949 | 34.46% | 1,355 | 11.82% | 2,207 | 19.26% | 11,460 | ||
| Crawford | 1,759 | 36.78% | 2,324 | 48.59% | 700 | 14.64% | -565 | -11.81% | 4,783 | ||
| Daviess | 5,531 | 56.70% | 3,230 | 33.11% | 994 | 10.19% | 2,301 | 23.59% | 9,755 | ||
| Dearborn | 8,318 | 50.97% | 6,269 | 38.42% | 1,731 | 10.61% | 2,049 | 12.56% | 16,318 | ||
| Decatur | 4,782 | 51.08% | 3,190 | 34.08% | 1,389 | 14.84% | 1,592 | 17.01% | 9,361 | ||
| DeKalb | 6,851 | 51.80% | 4,840 | 36.60% | 1,534 | 11.60% | 2,011 | 15.21% | 13,225 | ||
| Delaware | 18,126 | 40.68% | 20,385 | 45.75% | 6,042 | 13.56% | -2,259 | -5.07% | 44,553 | ||
| Dubois | 6,840 | 45.25% | 6,499 | 42.99% | 1,777 | 11.76% | 341 | 2.26% | 15,116 | ||
| Elkhart | 28,770 | 56.97% | 16,598 | 32.87% | 5,133 | 10.16% | 12,172 | 24.10% | 50,501 | ||
| Fayette | 4,091 | 45.20% | 3,822 | 42.23% | 1,137 | 12.56% | 269 | 2.97% | 9,050 | ||
| Floyd | 12,473 | 43.17% | 13,814 | 47.81% | 2,609 | 9.03% | -1,341 | -4.64% | 28,896 | ||
| Fountain | 3,984 | 54.25% | 2,327 | 31.69% | 1,033 | 14.07% | 1,657 | 22.56% | 7,344 | ||
| Franklin | 4,167 | 52.63% | 2,808 | 35.46% | 943 | 11.91% | 1,359 | 17.16% | 7,918 | ||
| Fulton | 3,934 | 48.97% | 2,956 | 36.80% | 1,143 | 14.23% | 978 | 12.17% | 8,033 | ||
| Gibson | 5,392 | 40.04% | 6,488 | 48.18% | 1,585 | 11.77% | -1,096 | -8.14% | 13,465 | ||
| Grant | 13,443 | 51.17% | 9,818 | 37.37% | 3,008 | 11.45% | 3,625 | 13.80% | 26,269 | ||
| Greene | 5,746 | 45.20% | 5,277 | 41.51% | 1,690 | 13.29% | 469 | 3.69% | 12,713 | ||
| Hamilton | 42,792 | 69.95% | 14,153 | 23.13% | 4,234 | 6.92% | 28,639 | 46.81% | 61,179 | ||
| Hancock | 12,907 | 60.63% | 6,123 | 28.76% | 2,258 | 10.61% | 6,784 | 31.87% | 21,288 | ||
| Harrison | 6,073 | 43.97% | 5,900 | 42.72% | 1,839 | 13.31% | 173 | 1.25% | 13,812 | ||
| Hendricks | 22,293 | 63.53% | 9,392 | 26.77% | 3,405 | 9.70% | 12,901 | 36.77% | 35,090 | ||
| Henry | 8,537 | 45.93% | 7,667 | 41.25% | 2,381 | 12.81% | 870 | 4.68% | 18,585 | ||
| Howard | 16,771 | 50.91% | 11,999 | 36.42% | 4,172 | 12.66% | 4,772 | 14.49% | 32,942 | ||
| Huntington | 8,275 | 59.27% | 4,287 | 30.70% | 1,400 | 10.03% | 3,988 | 28.56% | 13,962 | ||
| Jackson | 5,883 | 46.61% | 5,150 | 40.80% | 1,590 | 12.60% | 733 | 5.81% | 12,623 | ||
| Jasper | 5,173 | 51.74% | 3,554 | 35.55% | 1,271 | 12.71% | 1,619 | 16.19% | 9,998 | ||
| Jay | 3,584 | 45.01% | 3,356 | 42.15% | 1,022 | 12.84% | 228 | 2.86% | 7,962 | ||
| Jefferson | 4,827 | 41.24% | 5,441 | 46.48% | 1,438 | 12.28% | -614 | -5.25% | 11,706 | ||
| Jennings | 4,461 | 43.26% | 4,223 | 40.95% | 1,629 | 15.80% | 238 | 2.31% | 10,313 | ||
| Johnson | 23,733 | 60.88% | 11,278 | 28.93% | 3,975 | 10.20% | 12,455 | 31.95% | 38,986 | ||
| Knox | 6,395 | 41.47% | 7,003 | 45.42% | 2,022 | 13.11% | -608 | -3.94% | 15,420 | ||
| Kosciusko | 15,084 | 63.43% | 6,166 | 25.93% | 2,531 | 10.64% | 8,918 | 37.50% | 23,781 | ||
| LaGrange | 4,033 | 52.47% | 2,704 | 35.18% | 949 | 12.35% | 1,329 | 17.29% | 7,686 | ||
| Lake | 47,873 | 29.35% | 100,198 | 61.43% | 15,051 | 9.23% | -52,325 | -32.08% | 163,122 | ||
| LaPorte | 14,106 | 36.06% | 19,879 | 50.82% | 5,133 | 13.12% | -5,773 | -14.76% | 39,118 | ||
| Lawrence | 8,107 | 51.07% | 5,703 | 35.93% | 2,063 | 13.00% | 2,404 | 15.15% | 15,873 | ||
| Madison | 23,151 | 43.38% | 23,772 | 44.54% | 6,447 | 12.08% | -621 | -1.16% | 53,370 | ||
| Marion | 133,329 | 47.77% | 124,448 | 44.58% | 21,358 | 7.65% | 8,881 | 3.18% | 279,135 | ||
| Marshall | 8,158 | 53.17% | 5,486 | 35.76% | 1,698 | 11.07% | 2,672 | 17.42% | 15,342 | ||
| Martin | 2,281 | 49.44% | 1,848 | 40.05% | 485 | 10.51% | 433 | 9.38% | 4,614 | ||
| Miami | 6,719 | 53.17% | 4,260 | 33.71% | 1,657 | 13.11% | 2,459 | 19.46% | 12,636 | ||
| Monroe | 16,744 | 43.54% | 18,531 | 48.19% | 3,179 | 8.27% | -1,787 | -4.65% | 38,454 | ||
| Montgomery | 7,705 | 57.95% | 3,825 | 28.77% | 1,766 | 13.28% | 3,880 | 29.18% | 13,296 | ||
| Morgan | 12,872 | 60.04% | 5,812 | 27.11% | 2,755 | 12.85% | 7,060 | 32.93% | 21,439 | ||
| Newton | 2,075 | 43.47% | 1,897 | 39.74% | 801 | 16.78% | 178 | 3.73% | 4,773 | ||
| Noble | 6,782 | 50.60% | 5,101 | 38.06% | 1,521 | 11.35% | 1,681 | 12.54% | 13,404 | ||
| Ohio | 1,098 | 44.60% | 1,083 | 43.99% | 281 | 11.41% | 15 | 0.61% | 2,462 | ||
| Orange | 3,355 | 45.90% | 3,016 | 41.26% | 938 | 12.83% | 339 | 4.64% | 7,309 | ||
| Owen | 3,056 | 49.50% | 2,244 | 36.35% | 874 | 14.16% | 812 | 13.15% | 6,174 | ||
| Parke | 3,151 | 47.85% | 2,453 | 37.25% | 981 | 14.90% | 698 | 10.60% | 6,585 | ||
| Perry | 2,554 | 32.35% | 4,427 | 56.08% | 913 | 11.57% | -1,873 | -23.73% | 7,894 | ||
| Pike | 2,174 | 37.24% | 2,780 | 47.62% | 884 | 15.14% | -606 | -10.38% | 5,838 | ||
| Porter | 22,931 | 42.35% | 24,044 | 44.41% | 7,169 | 13.24% | -1,113 | -2.06% | 54,144 | ||
| Posey | 4,638 | 42.52% | 4,965 | 45.52% | 1,304 | 11.96% | -327 | -3.00% | 10,907 | ||
| Pulaski | 2,693 | 50.46% | 2,010 | 37.66% | 634 | 11.88% | 683 | 12.80% | 5,337 | ||
| Putnam | 5,958 | 51.63% | 3,962 | 34.34% | 1,619 | 14.03% | 1,996 | 17.30% | 11,539 | ||
| Randolph | 4,708 | 45.48% | 4,087 | 39.48% | 1,557 | 15.04% | 621 | 6.00% | 10,352 | ||
| Ripley | 5,303 | 49.95% | 4,097 | 38.59% | 1,216 | 11.45% | 1,206 | 11.36% | 10,616 | ||
| Rush | 3,827 | 51.87% | 2,578 | 34.94% | 973 | 13.19% | 1,249 | 16.93% | 7,378 | ||
| Saint Joseph | 2,620 | 36.50% | 3,798 | 52.91% | 760 | 10.59% | -1,178 | -16.41% | 7,178 | ||
| Scott | 7,778 | 51.76% | 5,374 | 35.76% | 1,874 | 12.47% | 2,404 | 16.00% | 15,026 | ||
| Shelby | 3,770 | 44.01% | 4,058 | 47.37% | 739 | 8.63% | -288 | -3.36% | 8,567 | ||
| Spencer | 38,281 | 41.45% | 45,704 | 49.48% | 8,379 | 9.07% | -7,423 | -8.04% | 92,364 | ||
| Starke | 3,108 | 38.57% | 3,854 | 47.83% | 1,096 | 13.60% | -746 | -9.26% | 8,058 | ||
| Steuben | 5,513 | 50.00% | 4,124 | 37.40% | 1,390 | 12.61% | 1,389 | 12.60% | 11,027 | ||
| Sullivan | 3,207 | 37.90% | 4,076 | 48.17% | 1,178 | 13.92% | -869 | -10.27% | 8,461 | ||
| Switzerland | 1,266 | 40.00% | 1,496 | 47.27% | 403 | 12.73% | -230 | -7.27% | 3,165 | ||
| Tippecanoe | 22,556 | 49.92% | 17,232 | 38.14% | 5,394 | 11.94% | 5,324 | 11.78% | 45,182 | ||
| Tipton | 3,980 | 54.38% | 2,478 | 33.86% | 861 | 11.76% | 1,502 | 20.52% | 7,319 | ||
| Union | 1,334 | 49.10% | 1,019 | 37.50% | 364 | 13.40% | 315 | 11.59% | 2,717 | ||
| Vanderburgh | 28,509 | 43.48% | 30,934 | 47.17% | 6,132 | 9.35% | -2,425 | -3.70% | 65,575 | ||
| Vermillion | 2,334 | 35.29% | 3,251 | 49.15% | 1,029 | 15.56% | -917 | -13.86% | 6,614 | ||
| Vigo | 15,751 | 41.20% | 17,974 | 47.01% | 4,508 | 11.79% | -2,223 | -5.81% | 38,233 | ||
| Wabash | 6,990 | 54.35% | 4,577 | 35.59% | 1,294 | 10.06% | 2,413 | 18.76% | 12,861 | ||
| Warren | 1,678 | 46.20% | 1,394 | 38.38% | 560 | 15.42% | 284 | 7.82% | 3,632 | ||
| Warrick | 9,221 | 43.96% | 9,285 | 44.26% | 2,471 | 11.78% | -64 | -0.31% | 20,977 | ||
| Washington | 4,066 | 44.44% | 3,819 | 41.74% | 1,264 | 13.82% | 247 | 2.70% | 9,149 | ||
| Wayne | 12,188 | 47.58% | 10,905 | 42.57% | 2,525 | 9.86% | 1,283 | 5.01% | 25,618 | ||
| Wells | 6,322 | 56.29% | 3,752 | 33.41% | 1,157 | 10.30% | 2,570 | 22.88% | 11,231 | ||
| White | 4,642 | 48.11% | 3,396 | 35.20% | 1,610 | 16.69% | 1,246 | 12.91% | 9,648 | ||
| Whitley | 5,965 | 51.72% | 4,176 | 36.21% | 1,392 | 12.07% | 1,789 | 15.51% | 11,533 | ||
| Totals | 1,006,693 | 47.52% | 887,424 | 41.89% | 224,299 | 10.59% | 17,426[lower-alpha 1] | 0.82% | 119,269 | 5.63% | 2,118,416 |
Notes
- These Libertarian and write-in votes were not given by county in the Our Campaigns site.
References
- "1996 Presidential General Election Results – Indiana". Dave Leip's Atlas of U.S. Presidential Elections. Retrieved 2019-10-19.
- Menendez, Albert J.; The Geography of Presidential Elections in the United States, 1868-2004, p. 117 ISBN 0786422173
- Sullivan, Robert David; ‘How the Red and Blue Map Evolved Over the Past Century’; America Magazine in The National Catholic Review; June 29, 2016
- Our Campaigns; IN US President 1996