Hamilton County, Indiana
Hamilton County is a county in the U.S. state of Indiana. Census 2010 recorded a population of 274,569.[1] The county seat is Noblesville.
Hamilton County | |
|---|---|
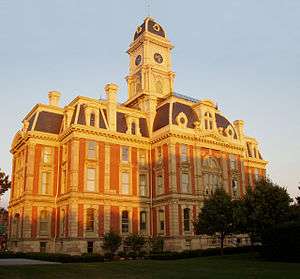 Hamilton County courthouse in Noblesville, Indiana | |
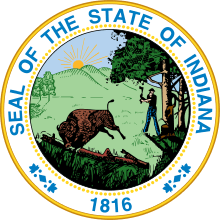
 Seal | |
 Location within the U.S. state of Indiana | |
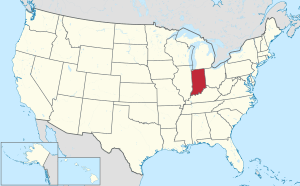 Indiana's location within the U.S. | |
| Coordinates: 40°04′N 86°03′W | |
| Country | |
| State | |
| Founded | 1823 |
| Named for | Alexander Hamilton |
| Seat | Noblesville |
| Largest city | Carmel |
| Area | |
| • Total | 402.44 sq mi (1,042.3 km2) |
| • Land | 394.27 sq mi (1,021.2 km2) |
| • Water | 8.17 sq mi (21.2 km2) 2.03%% |
| Population | |
| • Estimate (2019) | 338,011 |
| • Density | 690/sq mi (266/km2) |
| Time zone | UTC−5 (Eastern) |
| • Summer (DST) | UTC−4 (EDT) |
| Congressional district | 5th |
| Website | www |
| |
Hamilton County is part of the Indianapolis-Carmel-Anderson, IN Metropolitan Statistical Area. Since the beginning of the 21st century, Hamilton County has been the second most populous county in Central Indiana.
Hamilton County's roots are in agriculture. However, after World War II, Indianapolis grew north and towns in the southern part of the county developed as suburbs. Residential and commercial development have replaced many farm fields. The northern part of the county remains largely agricultural. Today, the county is one of the fastest-growing counties in the United States. According to 2007 estimates by the U.S. Census, the county's population increased from an estimated 182,740 in 2000 to 261,661 in 2007, making it the fastest-growing county in Indiana out of 92. Recently, Hamilton County surpassed St. Joseph County in population, making it the state's fourth most populous.[2] It is also the third densest in the state, after Marion and Lake Counties.
In 2010, Hamilton County was home to three of the state's 20 largest cities and towns: Carmel (8th), Fishers (9th), and Noblesville (14th).
Geist and Morse reservoirs are two man-made lakes in Hamilton County that offer recreational opportunities such as boating, fishing, and waterfront living.
In June 2008, Hamilton County was named America's Best Place to Raise a Family by Forbes.com[3] due to its strong economy, affordable living, top-ranked schools, and close proximity to Indianapolis. The city of Carmel in southwestern Hamilton County was designated CNN Money's top place to live in 2013[4] and in 2017, the city of Fishers was named best place to live.[5]
History
The land containing Hamilton County was brought into the possession of the United States by the Treaty of St. Mary's in 1818. William Conner was the first white settler in the county. In the summer of 1822, after realizing there were enough settlers in the area, Conner and other settlers applied to the Indiana Legislature for a charter authorizing them to become a separate and independent county under Indiana law. The application was presented to the Legislature at the 1822-23 session and the act was passed and approved by the governor on January 8, 1823. The act took effect on the first Monday in April (April 7), 1823. The County Commissioners first met on May 5, 1823, at the house of William Conner. Conner's house would also serve as the County Circuit Court. The county was named after Alexander Hamilton, the first secretary of the treasury.[6][7][8]
Climate and weather
| Noblesville, Indiana | ||||||||||||||||||||||||||||||||||||||||||||||||||||||||||||
|---|---|---|---|---|---|---|---|---|---|---|---|---|---|---|---|---|---|---|---|---|---|---|---|---|---|---|---|---|---|---|---|---|---|---|---|---|---|---|---|---|---|---|---|---|---|---|---|---|---|---|---|---|---|---|---|---|---|---|---|---|
| Climate chart (explanation) | ||||||||||||||||||||||||||||||||||||||||||||||||||||||||||||
| ||||||||||||||||||||||||||||||||||||||||||||||||||||||||||||
| ||||||||||||||||||||||||||||||||||||||||||||||||||||||||||||
In recent years, average temperatures in Noblesville have ranged from a low of 17 °F (−8 °C) in January to a high of 85 °F (29 °C) in July, although a record low of −23 °F (−31 °C) was recorded in January 1994 and a record high of 105 °F (41 °C) was recorded in July 1954. Average monthly precipitation ranged from 2.42 inches (61 mm) in January to 4.86 inches (123 mm) in May. Hamilton County's climate thus falls within the Köppen climate classification system as a humid continental temperate climate, with pleasant spring and fall seasons surrounded by harsh cold and humid heat in the winter and summer, respectively.[9]
Government
The county executive body is filled by the Board of County Commissioners. The Board of County Commissioners consists of three Commissioners representing their three respective districts.
District 1 consists of Carmel, which is coextensive with Clay Township. District 2 consists of Fishers, Noblesville, Delaware Township, and Noblesville Township. District 3 consists of Adams Township, Fall Creek Township, Jackson Township, Washington Township, Wayne Township, White River Township, Arcadia, Atlanta, Cicero, Sheridan and Westfield.
The current County Commissioners are:
- Christine Altman - District 1
- Steven C. Dillinger - District 2
- Mark Heirbrandt - District 3
The county's finances are managed by the County Council, which consists of seven members, four elected by district and three elected at-large.
District 1 consists of parts of Clay Township (45 precincts). District 2 consists of Delaware, Fall Creek, and Wayne Townships. District 3 consists of Noblesville, Jackson and White River Townships. District 4 consists of parts of Clay Township (17 precincts), Adams and Washington Townships.
The current members of the County Council are:
- Fred Glynn - District 1
- Amy Massillamany - District 2
- Steve Schwartz1 - District 3
- Paul Ayers - District 4
- Brad Beaver - Council member at large
- Jim Belden - Council member at large
- Rick McKinney - Council member at large
Hamilton County is part of Indiana's 5th congressional district; Indiana Senate districts 20, 21, 28, 29 and 30;[10] and Indiana House of Representatives districts 29, 32, 35, 36, 38, 39, 86, 87 and 88.[11]
Politics
The county is located in Indiana's 5th congressional district, which is represented by Susan Brooks.
Hamilton County has been won by every Republican presidential candidate since Charles Evans Hughes in 1916. In 1912, Democratic candidate Woodrow Wilson had carried the county with a 3.06% plurality over Republican opponent William Taft.[12]
Hamilton County's loyalty to the Republican Party is not limited to presidential elections. The county regularly rejects Democrats in gubernatorial and senatorial races, and is typically one of the Republicans' strongest counties at the state level. One of the few times in recent memory that Hamilton County has supported a Democrat for governor or Senate was in 1992, when Evan Bayh narrowly carried it with 50.48 percent of the vote in his successful reelection bid. However, Bayh lost Hamilton County in his three bids for Senate.
Despite these facts, however, the county is slowly tilting more Democratic. Donald Trump in 2016 gave the weakest showing for a Republican nominee since Herbert Hoover in 1932, despite his statewide dominance that year, winning just 56% of the vote. Thus, Hamilton County voted less Republican than the rest of the state for the first time in almost 100 years, even though Trump still carried the county. Eight years earlier, Barack Obama received 38.45% of the county vote during the 2008 election, the strongest result for a Democrat since Franklin Roosevelt in 1936. Joe Donnelly in his 2018 senate re-election loss also came less than 10% away from winning the county, winning 44.4% of the vote.[13]
| Year | Republican | Democratic | Third parties |
|---|---|---|---|
| 2016 | 56.0% 87,404 | 36.7% 57,263 | 7.2% 11,291 |
| 2012 | 66.2% 90,747 | 32.0% 43,796 | 1.9% 2,546 |
| 2008 | 60.6% 78,401 | 38.5% 49,704 | 0.9% 1,174 |
| 2004 | 74.2% 77,887 | 25.2% 26,388 | 0.6% 631 |
| 2000 | 74.3% 56,372 | 23.7% 18,002 | 2.0% 1,552 |
| 1996 | 69.5% 42,792 | 23.0% 14,153 | 7.6% 4,674 |
| 1992 | 62.5% 34,622 | 18.4% 10,215 | 19.1% 10,597 |
| 1988 | 80.4% 36,654 | 19.4% 8,853 | 0.2% 108 |
| 1984 | 82.3% 30,254 | 17.3% 6,364 | 0.4% 143 |
| 1980 | 74.2% 26,218 | 19.9% 7,036 | 5.9% 2,073 |
| 1976 | 72.9% 21,828 | 26.2% 7,857 | 0.9% 273 |
| 1972 | 82.7% 20,247 | 17.0% 4,151 | 0.3% 72 |
| 1968 | 67.6% 14,250 | 21.8% 4,586 | 10.6% 2,233 |
| 1964 | 61.3% 12,060 | 38.4% 7,553 | 0.4% 68 |
| 1960 | 70.6% 13,409 | 29.0% 5,511 | 0.3% 64 |
| 1956 | 69.0% 11,220 | 30.6% 4,974 | 0.5% 77 |
| 1952 | 69.7% 10,843 | 29.3% 4,564 | 1.0% 153 |
| 1948 | 62.1% 7,521 | 36.2% 4,384 | 1.7% 202 |
| 1944 | 66.1% 8,297 | 32.7% 4,101 | 1.3% 162 |
| 1940 | 64.7% 8,931 | 34.7% 4,791 | 0.5% 75 |
| 1936 | 56.9% 7,323 | 41.9% 5,396 | 1.2% 151 |
| 1932 | 53.1% 7,100 | 44.9% 5,999 | 2.1% 277 |
| 1928 | 68.4% 7,960 | 31.0% 3,611 | 0.6% 74 |
| 1924 | 64.9% 7,463 | 32.9% 3,785 | 2.2% 250 |
| 1920 | 63.0% 7,897 | 34.2% 4,280 | 2.8% 350 |
| 1916 | 54.8% 3,951 | 38.8% 2,799 | 6.4% 462 |
| 1912 | 31.9% 2,247 | 34.9% 2,463 | 33.2% 2,342 |
| 1908 | 56.5% 4,421 | 37.7% 2,947 | 5.9% 460 |
| 1904 | 63.5% 4,832 | 32.4% 2,469 | 4.1% 309 |
| 1900 | 58.6% 4,788 | 35.9% 2,931 | 5.5% 449 |
| 1896 | 59.8% 4,643 | 38.0% 2,947 | 2.2% 171 |
| 1892 | 54.5% 3,627 | 37.5% 2,492 | 8.0% 533 |
| 1888 | 56.0% 3,599 | 37.6% 2,412 | 6.4% 411 |
Geography
According to the 2010 census, the county has a total area of 402.44 square miles (1,042.3 km2), of which 394.27 square miles (1,021.2 km2) (or 97.97%) is land and 8.17 square miles (21.2 km2) (or 2.03%) is water.[15]
Major highways
Airport
Adjacent counties
- Tipton County (North)
- Madison County (East)
- Hancock County (Southeast)
- Marion County (South)
- Boone County (West)
- Clinton County (Northwest)
Demographics
| Historical population | |||
|---|---|---|---|
| Census | Pop. | %± | |
| 1890 | 26,123 | — | |
| 1900 | 29,914 | 14.5% | |
| 1910 | 27,026 | −9.7% | |
| 1920 | 24,222 | −10.4% | |
| 1930 | 23,444 | −3.2% | |
| 1940 | 24,614 | 5.0% | |
| 1950 | 28,491 | 15.8% | |
| 1960 | 40,132 | 40.9% | |
| 1970 | 54,532 | 35.9% | |
| 1980 | 82,027 | 50.4% | |
| 1990 | 108,936 | 32.8% | |
| 2000 | 182,740 | 67.7% | |
| 2010 | 274,569 | 50.3% | |
| Est. 2019 | 338,011 | [16] | 23.1% |
| U.S. Decennial Census[17] 1790-1960[18] 1900-1990[19] 1990-2000[20] 2010-2019[1] | |||
2010 Census

As of the 2010 United States Census, there were 274,569 people, 99,835 households, and 74,755 families residing in the county.[21] The population density was 696.4 inhabitants per square mile (268.9/km2). There were 106,772 housing units at an average density of 270.8 per square mile (104.6/km2).[15] The racial makeup of the county was 88.5% white, 4.8% Asian, 3.5% black or African American, 0.2% American Indian, 1.2% from other races, and 1.8% from two or more races. Those of Hispanic or Latino origin made up 3.4% of the population.[21] In terms of ancestry, 29.0% were German, 14.6% were Irish, 13.0% were English, and 7.7% were American.[22]
Of the 99,835 households, 43.2% had children under the age of 18 living with them, 63.2% were married couples living together, 8.3% had a female householder with no husband present, 25.1% were non-families, and 20.5% of all households were made up of individuals. The average household size was 2.73 and the average family size was 3.19. The median age was 35.6 years.[21]
The median income for a household in the county was $47,697 and the median income for a family was $95,376. Males had a median income of $67,221 versus $44,273 for females. The per capita income for the county was $38,500. About 3.6% of families and 4.5% of the population were below the poverty line, including 5.6% of those under age 18 and 3.5% of those age 65 or over.[23]
Life expectancy
The life expectancy in Hamilton County in 2010 was 81.21 years, up 6.6 percent from 76.16 years in 1980. [24][25] By comparison, the U.S. national average in 2010 was 78.49 years.[26][27]
References
- "Hamilton County QuickFacts". United States Census Bureau. Archived from the original on 2011-06-08. Retrieved 2011-09-17.
- "Hamilton takes top spot in county headcount". The Indianapolis Star. Gannett Company. 2008-03-21. Retrieved 2008-03-21.
- "In Depth: America's Best Places To Raise A Family - Forbes.com". Forbes. Archived from the original on 2016-03-03.
- http://money.cnn.com/magazines/moneymag/bplive/2012/top100/. Missing or empty
|title=(help) - "Fishers, Indiana is MONEY's No. 1 Best Place to Live in America". Money. Retrieved 2018-07-17.
- "Hamilton County stats". Indiana.edu. Archived from the original on 2007-07-08. Retrieved 2007-06-30.
- De Witt Clinton Goodrich & Charles Richard Tuttle (1875). An Illustrated History of the State of Indiana. Indiana: R. S. Peale & co. p. 560.
- Gannett, Henry (1905). The Origin of Certain Place Names in the United States. Govt. Print. Off. pp. 147.
- "Monthly Averages for Noblesville, Indiana". The Weather Channel. Archived from the original on 2012-10-23. Retrieved 2011-01-27.
- "Indiana Senate Districts". State of Indiana. Archived from the original on 2011-01-15. Retrieved 2011-07-14.
- "Indiana House Districts". State of Indiana. Archived from the original on 2011-01-15. Retrieved 2011-07-14.
- David Leip's Presidential Atlas (Maps for Indiana by election) Archived 2008-11-30 at the Wayback Machine Results prior to 1960 available through subscription only
- "Indiana Election Results 2018". Politico.
- Leip, David. "Dave Leip's Atlas of U.S. Presidential Elections". uselectionatlas.org. Archived from the original on 2018-03-23.
- "Population, Housing Units, Area, and Density: 2010 - County". United States Census Bureau. Archived from the original on 2020-02-12. Retrieved 2015-07-10.
- "Population and Housing Unit Estimates". Retrieved March 26, 2020.
- "U.S. Decennial Census". United States Census Bureau. Retrieved July 10, 2014.
- "Historical Census Browser". University of Virginia Library. Archived from the original on August 11, 2012. Retrieved July 10, 2014.
- "Population of Counties by Decennial Census: 1900 to 1990". United States Census Bureau. Archived from the original on October 4, 2014. Retrieved July 10, 2014.
- "Census 2000 PHC-T-4. Ranking Tables for Counties: 1990 and 2000" (PDF). United States Census Bureau. Archived (PDF) from the original on December 18, 2014. Retrieved July 10, 2014.
- "DP-1 Profile of General Population and Housing Characteristics: 2010 Demographic Profile Data". United States Census Bureau. Archived from the original on 2020-02-13. Retrieved 2015-07-10.
- "DP02 SELECTED SOCIAL CHARACTERISTICS IN THE UNITED STATES – 2006-2010 American Community Survey 5-Year Estimates". United States Census Bureau. Archived from the original on 2020-02-14. Retrieved 2015-07-10.
- "DP03 SELECTED ECONOMIC CHARACTERISTICS – 2006-2010 American Community Survey 5-Year Estimates". United States Census Bureau. Archived from the original on 2020-02-14. Retrieved 2015-07-10.
- "US Data | GHDx". ghdx.healthdata.org. Retrieved 2020-03-31.
- "USA LIFE EXPECTANCY from 1985-2010".
- "U.S. Life Expectancy 1950-2020". www.macrotrends.net. Retrieved 2020-03-31.
- www.countyhealthrankings.org https://www.countyhealthrankings.org/app/indiana/2019/measure/outcomes/147/data?sort=desc-2. Retrieved 2020-03-31. Missing or empty
|title=(help)
- History of Hamilton County, Indiana, with Illustrations and Biographical Sketches of Some of its Prominent Men and Pioneers, To Which are Appended Maps of its Several Townships. Chicago: Kingman Brothers. 1880. Archived from the original on 2007-02-24. Retrieved 2007-03-25.
- "The fastest growing county in the state ... and then some". The Indianapolis Star. Retrieved 2007-03-25.
- "Hamilton's growth keeps it in Top 30". The Indianapolis Star. March 22, 2007. Retrieved 2007-03-25.
- "Hamilton County, Indiana Government Website". Hamilton County government. Retrieved 2007-03-26.
External links
Places adjacent to Hamilton County, Indiana | ||||||||||
|---|---|---|---|---|---|---|---|---|---|---|
| ||||||||||
Municipalities and communities of Hamilton County, Indiana, United States | ||
|---|---|---|
| Cities | Map of Indiana highlighting Hamilton County | |
| Towns | ||
| Townships | ||
| Unincorporated communities | ||
| Footnotes | ‡This populated place also has portions in an adjacent county or counties | |
.jpg)
| Authority control |
|
|---|